


LTC and EOS – Impulsive Decline Expected
FXOpen

LTC/USD
From yesterday’s high at $44.66 the price of Litecoin has fallen by 6.54% today as it made interaction with its current significant horizontal support level at $41.714 at its lowest point. The price found support which is why the interaction ended as a bounce with the price currently being traded around $42.86 and is in a slight upward trajectory.
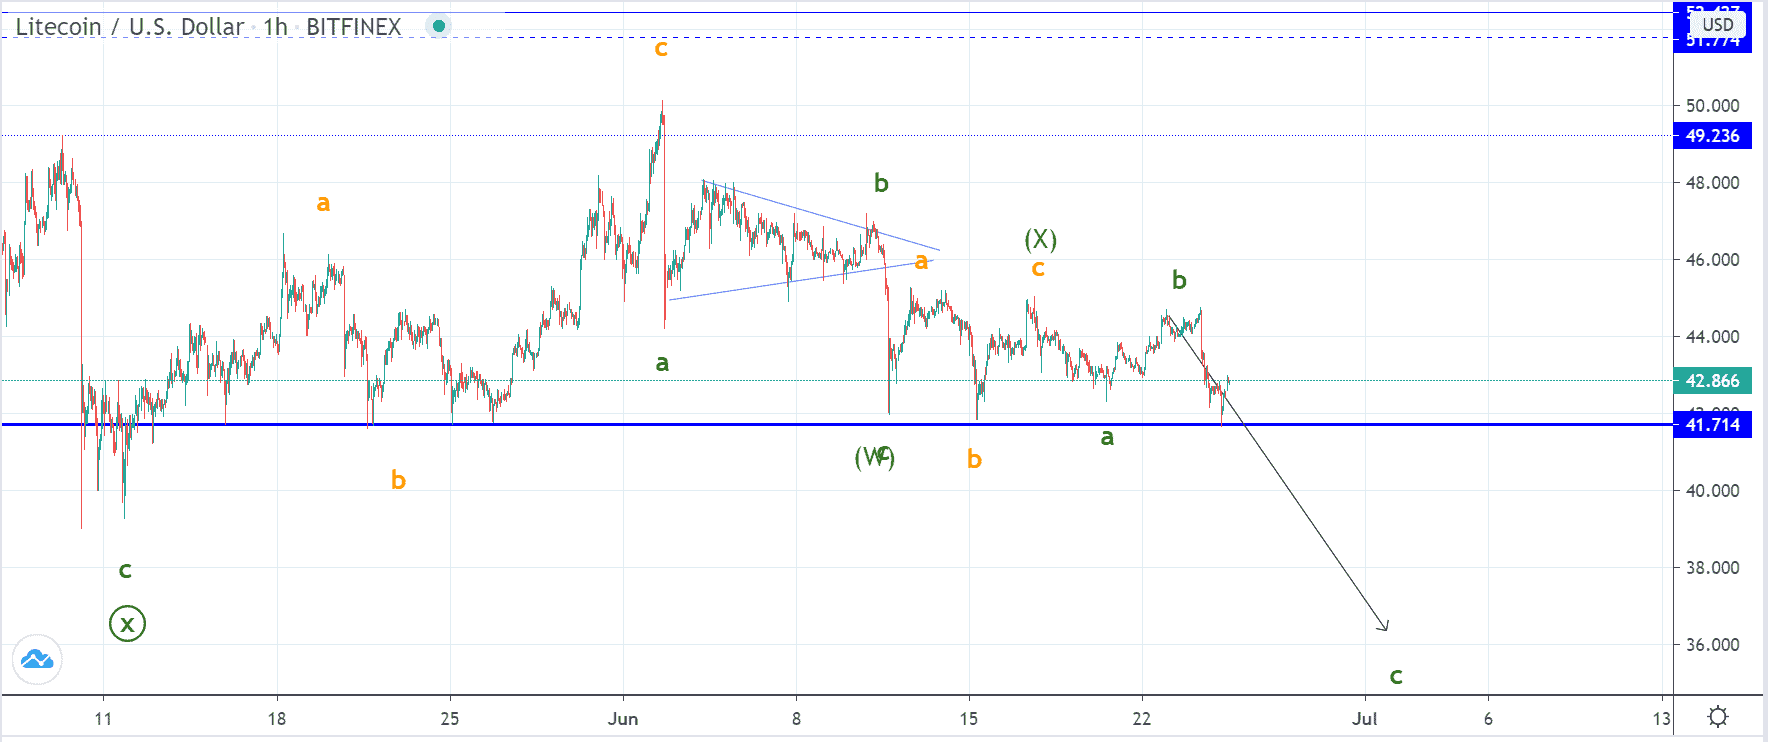 On the hourly chart, you can see that this descending move has been expected to push the price below the significant horizontal support level as we are most likely seeing the start of the C wave from the lower degree count as the third ABC correction is to develop. This should be another sub-wave of the higher degree correction and is it Y wave, but it could also be a five-wave decrease if the price is to impulsively move to the downside.
As the C wave would develop in a five-wave manner as well it is still unclear whether or not we are seeing a three-wave correction or the 3rd wave out of the five-wave impulse so the price target for the expected decrease is still uncertain, but projecting the level of the first ABC or wave W of a higher degree on to the assumed ending point of the X wave we come up to the target of around $36.3.
EOS/USD
The price of EOS has decreased by 6.37% from yesterday’s high at $2.599 to $2.4341 at it’s lowest point today. As in the case of Litecoin, it made it till its lower boundary which was retested numerous times from the first downfall on the 11th of June and the price found support like it did today, but as the level gets weakened this is unlikely to continue providing further support.
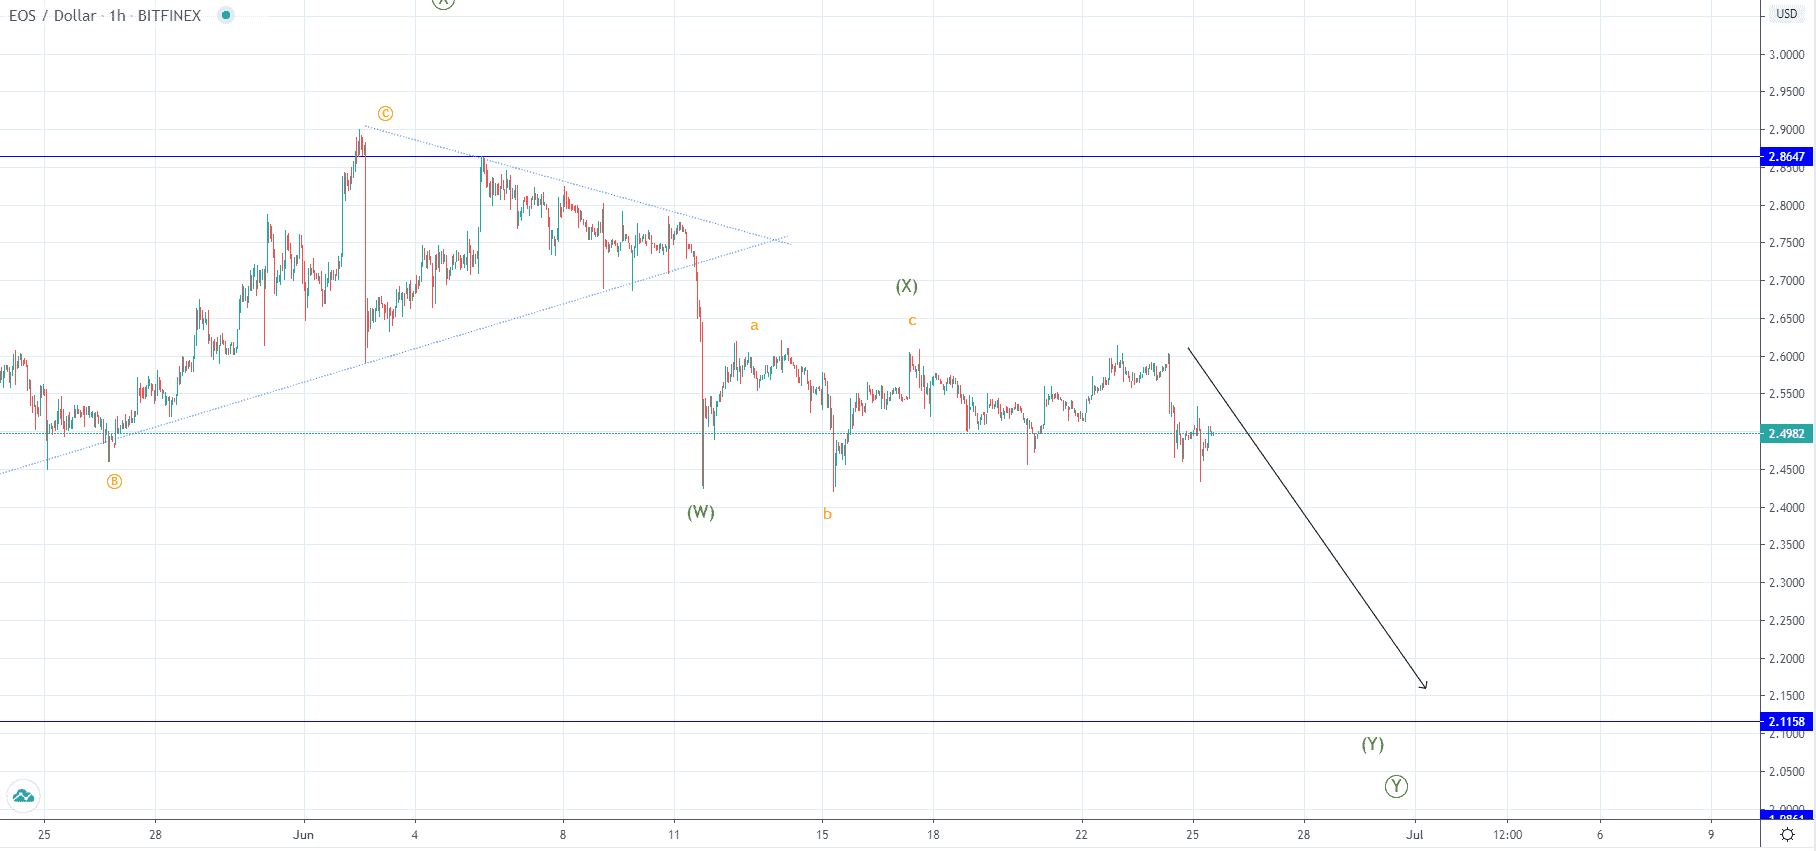 As you can see from the hourly chart, the price action made a similar pattern as we have seen a shart decrease made in a three-wave manner after which a three-wave move to the upside has been seen. This has been labeled as the first two sub-waves of the higher degree corrective movement which is why now another descending move would be expected to play out as the 3rd sub-wave, or the wave Y.
The first significant support level to the downside would be around $2.115 but the price could continue moving below it depending on the momentum and the strength of the seller’s pressure. If we are seeing the development of the Y wave then it would be sub-divided into another ABC count out of which we have already seen the development of the waves A and B so now a C which would be an impulsive 1,2,3,4,5 is to be expected.
FXOpen offers the world's most popular cryptocurrency CFDs*, including Bitcoin and Ethereum. Floating spreads, 1:2 leverage — at your service (additional fees may apply). Open your trading account now or learn more about crypto CFD trading with FXOpen.
*Important: At FXOpen UK, Cryptocurrency trading via CFDs is only available to our Professional clients. They are not available for trading by Retail clients. To find out more information about how this may affect you, please get in touch with our team.
This article represents the opinion of the Companies operating under the FXOpen brand only. It is not to be construed as an offer, solicitation, or recommendation with respect to products and services provided by the Companies operating under the FXOpen brand, nor is it to be considered financial advice.
Stay ahead of the market!
Subscribe now to our mailing list and receive the latest market news and insights delivered directly to your inbox.


Latest articles

Apple: Earnings Day Above the Activity Zone
On 30 April, after the market close, Apple Inc. will release its financial results for the second quarter of fiscal 2026. The consensus forecast, based on estimates from 31 analysts, points to revenue of around $109.7 billion, with expected

USD/JPY and USD/CHF Near Key Levels: The Dollar Supported by the Fed
The US dollar continues to trend upwards following the Federal Reserve meeting, drawing support from the regulator’s moderately hawkish stance and comments by Jerome Powell. Markets interpret the Fed’s rhetoric as a signal that restrictive policy is likely

EUR/USD and GBP/USD consolidate ahead of the Fed decision
European currencies are showing subdued dynamics, entering a consolidation phase following their previous advance. Earlier, EUR/USD and GBP/USD broke out of their ranges and strengthened; however, the subsequent correction has led both pairs to retest the previously breached