


FXOpen

LTC/USD
From last Thursday when the price of Litecoin was sitting at it’s highest at around $50.57 we have seen a decrease of 11.42% as it came down to $44.86 at its lowest point today. Since then we have seen a slight increase with the price currently being traded at around $45.89.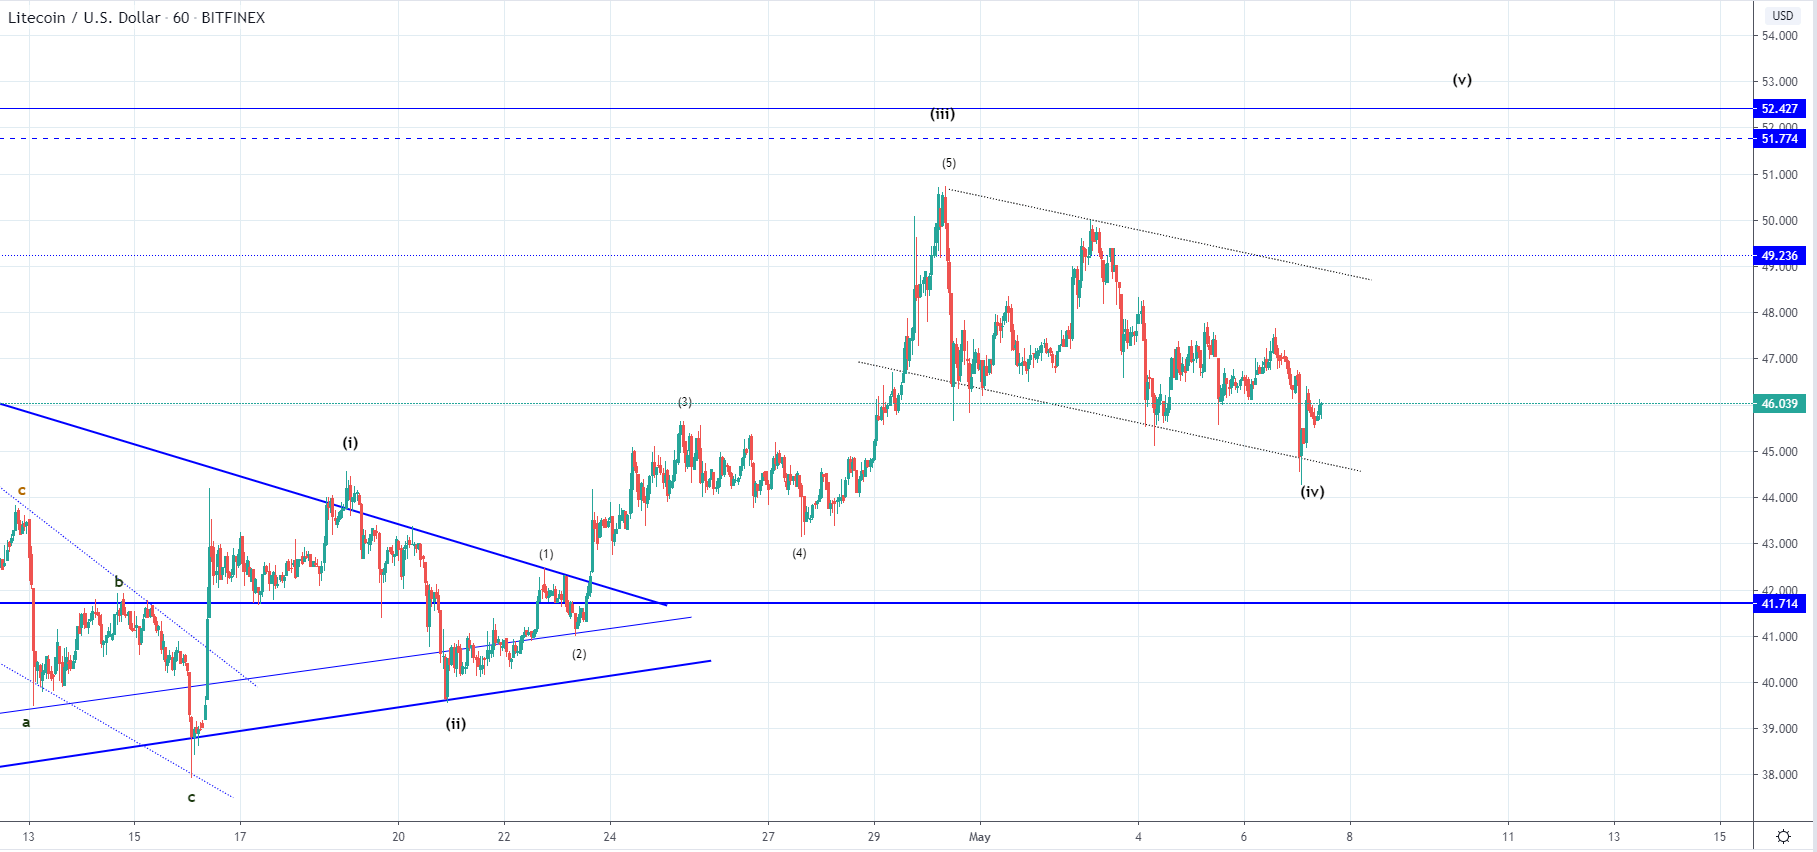 Looking at the hourly chart, you can see that the price came down in a descending channel that started forming since last Thursdays high and interacted with its support level today where it found support once again. As the price bounced from the support level we could have seen the completion of the correction with the price now starting another wave to the upside.
If the price of Litecoin has ended it’s corrective stage the next move to the upside would lead it into a breakout from the descending channel and potentially on to the $52 level as we are most likely seeing the development of the 4th wave out of the higher degree count.
We could see further retest of the descending channel’s boundaries but it looks like it’s starting to get close to the vicinity of the 1st wave’s ending point at $44.3 so there isn’t much room to go. If the price, however, continued moving below $44.3 point it could invalidate the possibility of the uptrend continuation in the 5th wave but that isn’t as likely.
EOS/USD
The price of EOS has decreased by 15.77% from last week’s Thursday as it came down from $3.1 to $2.61 at it’s lowest point today, but like in the case of LTC found support on it’s descending trendline and has started increasing again.
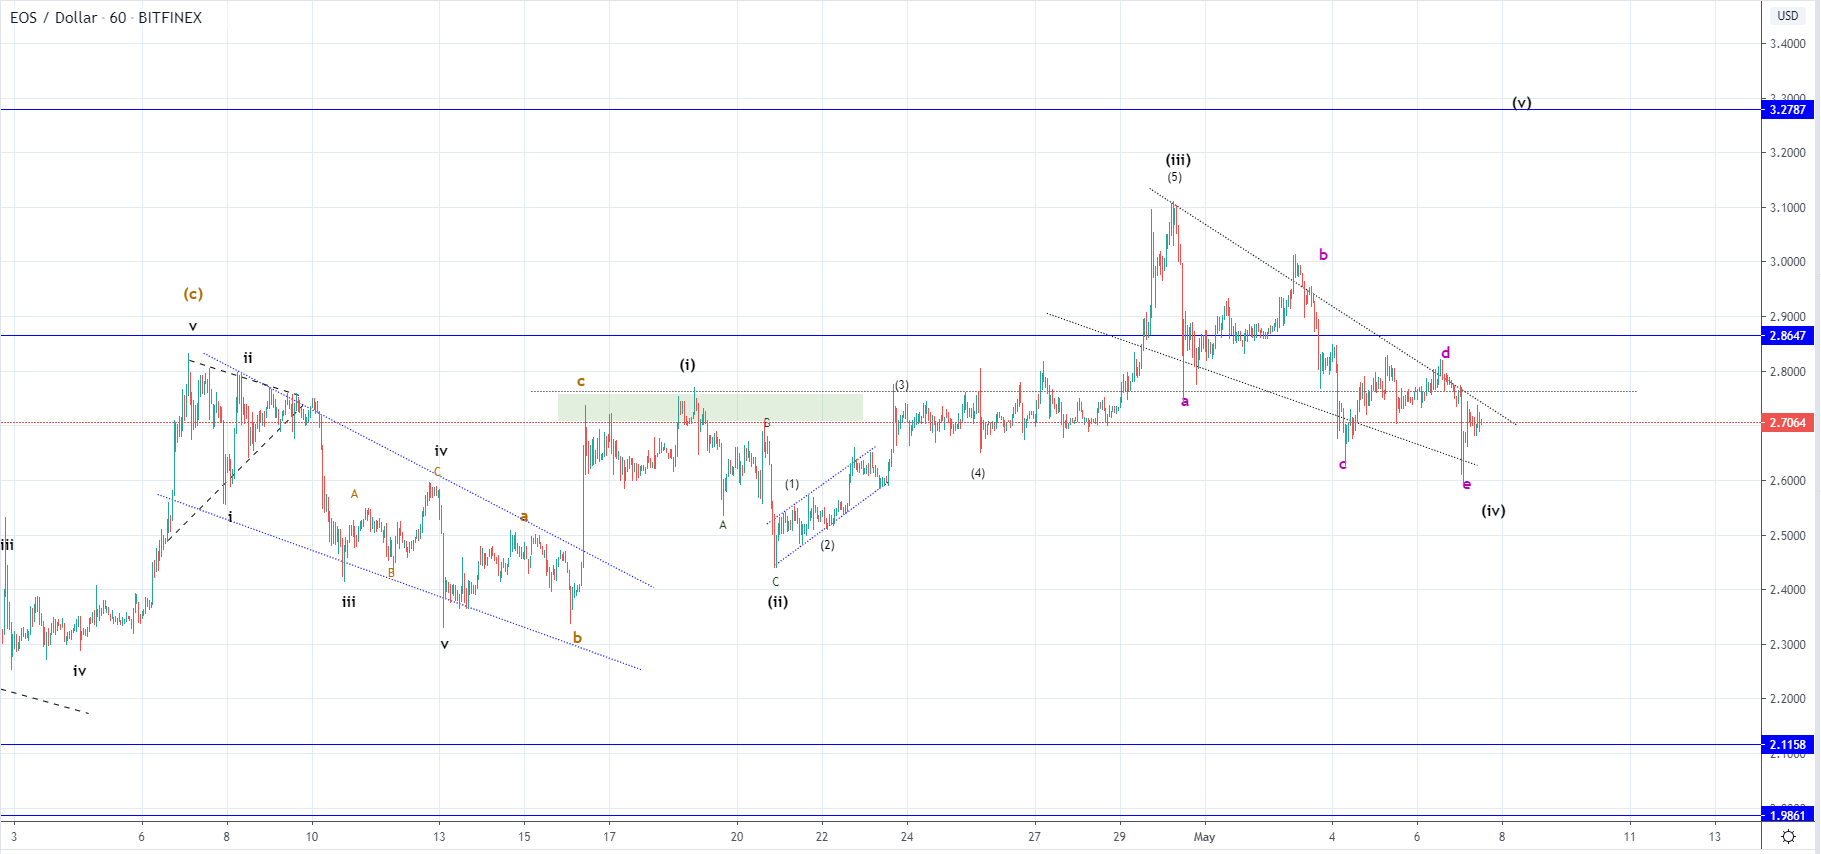
On the hourly chart, you can see that the price fell inside the territory of the presumed 1st wave of the higher degree invalidating the impulsive count which was started as a possibility in the case of Litecoin. This could serve as an early indication that the price of LTC is going to do the same but never the less from here I would be expecting an increase.
The descending structure made a five-wave move which could be an ABCDE correction especially considering that it appears to be more of a triangle then a channel. The next horizontal level in line to the upside is at $3.2 so it looks highly probable that the price is headed towards the level but we are yet to see from which side a breakout will be made from the current descending structure.
FXOpen offers the world's most popular cryptocurrency CFDs*, including Bitcoin and Ethereum. Floating spreads, 1:2 leverage — at your service. Open your trading account now or learn more about crypto CFD trading with FXOpen.
*At FXOpen UK and FXOpen AU, Cryptocurrency CFDs are only available for trading by those clients categorised as Professional clients under FCA Rules and Professional clients under ASIC Rules respectively. They are not available for trading by Retail clients.
This article represents the opinion of the Companies operating under the FXOpen brand only. It is not to be construed as an offer, solicitation, or recommendation with respect to products and services provided by the Companies operating under the FXOpen brand, nor is it to be considered financial advice.
Stay ahead of the market!
Subscribe now to our mailing list and receive the latest market news and insights delivered directly to your inbox.

Latest articles

Weekly Market Wrap With Gary Thomson: Nasdaq, EUR/USD, USD/CHF, Brent Crude Oil, Googl Shares
Get the latest scoop on the week's hottest headlines, all in one convenient video. Join Gary Thomson, the COO of FXOpen UK, as he breaks down the most significant news reports and shares his expert insights.
- Nasdaq Composite: Worst Session

Analysis of AUD/USD: Exchange Rate Falls to Early May Low
As indicated by the 4-hour AUD/USD chart today:
→ the rate fell below 0.652, a level last seen on May 2;
→ the RSI indicator dropped below 15, a level last seen during the panic over the spread of COVID-19

Analysis of AMZN Stock: Price at 1.5-Month Low
As shown in the AMZN chart, the stock price dropped below:
→ the psychological level of $180;
→ the mid-June interim low.
The last time AMZN traded below $180 was in early June.
Thus, AMZN has faced sell-offs, similar to other tech