


LTC and EOS - Increase seen but for how long?
FXOpen

LTC/USD
Since the start of the week, the price of Litecoin has increased by 6.78% coming from Monday’s low at $39.613 to $42.3 at it’s highest point today. From there we have seen a decrease of 3% but a slight recovery after with the price currently being traded at $41.37.
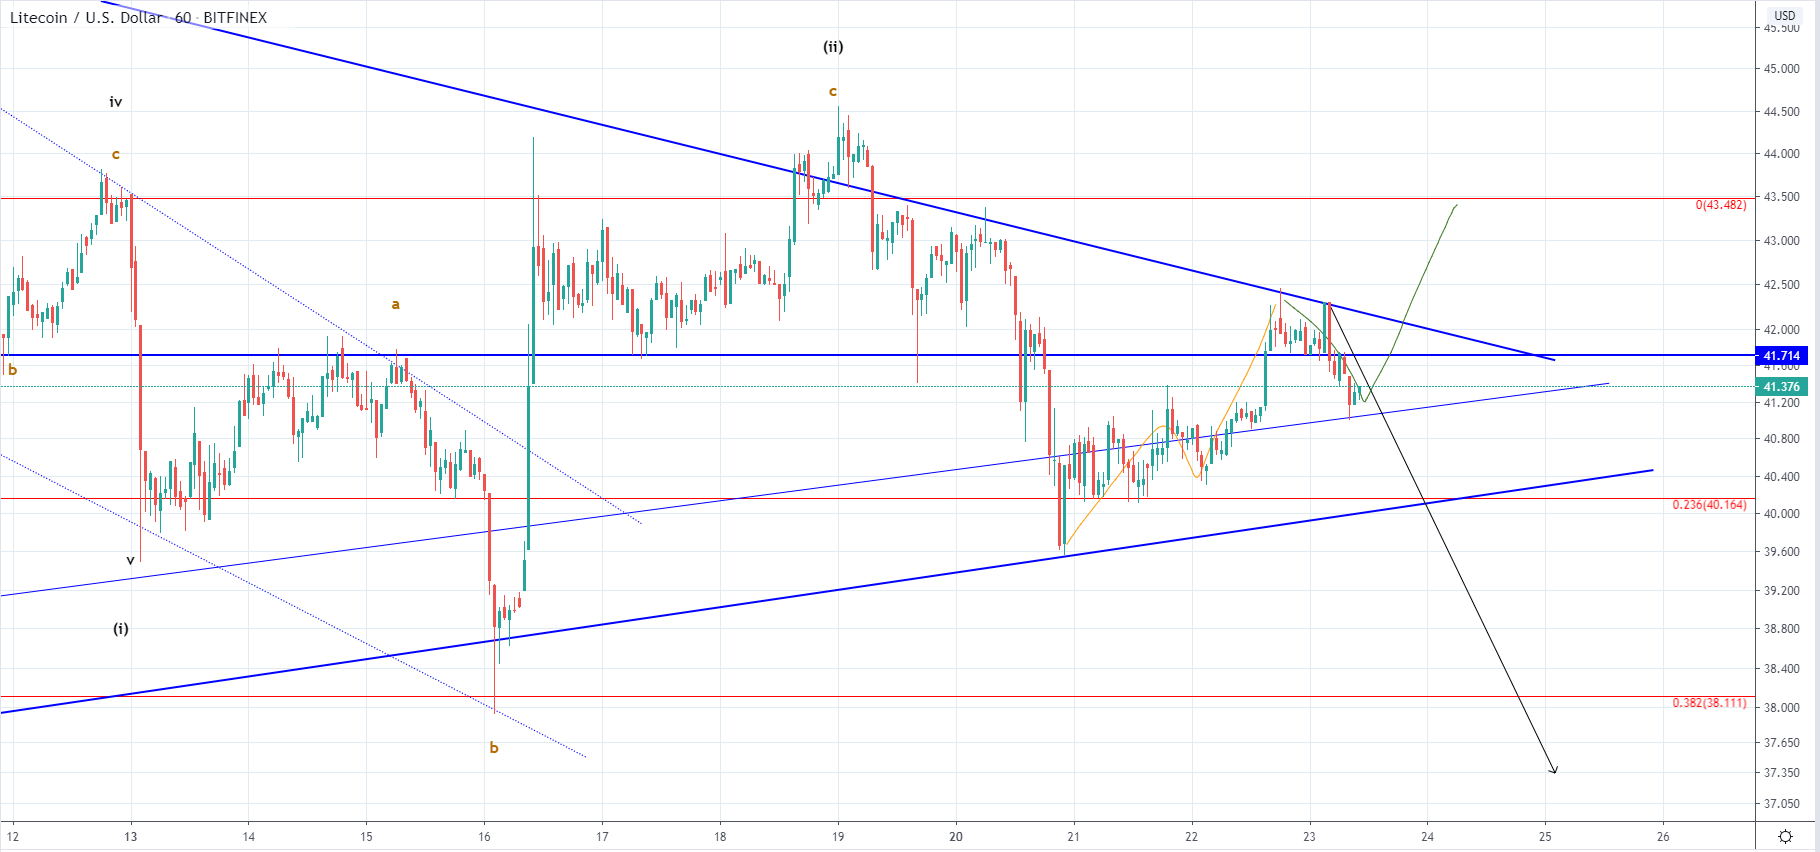 Looking at the hourly chart, you can see that the price of Litecoin came up above the $41.7 horizontal level and interacted with the symmetrical triangle's resistance level where it got rejected. This pushed the price below the horizontal level and into a lower range but the price found support on the upper ascending support level which is why we are seeing minor bullish price action.
This increase could have been the completion of the corrective three-wave move to the upside after an impulsive move of a lower degree ended. In that case, the price is to continue moving to the downside below the lower ascending trendline which is the symmetrical triangle’s support level. But if we have seen a three-wave decrease prior to the bullish price action then the current structure could develop in a five-wave manner in which case it’s going to make a breakout to the upside.
The pivot point for validation of the bearish scenario would be a fall inside the territory of the presumed 2nd wave below $41.1. But if the price starts impulsively increasing from here and comes above the horizontal level at $41.73 the bullish scenario would look more likely.
EOS/USD
From it’s lowest point on Monday at $2.441 the price of EOS has increased by 8.58% measured to the highest point the price has been today which was at $2.65. Currently, it is being traded at $2.6 as a minor pullback occurred.
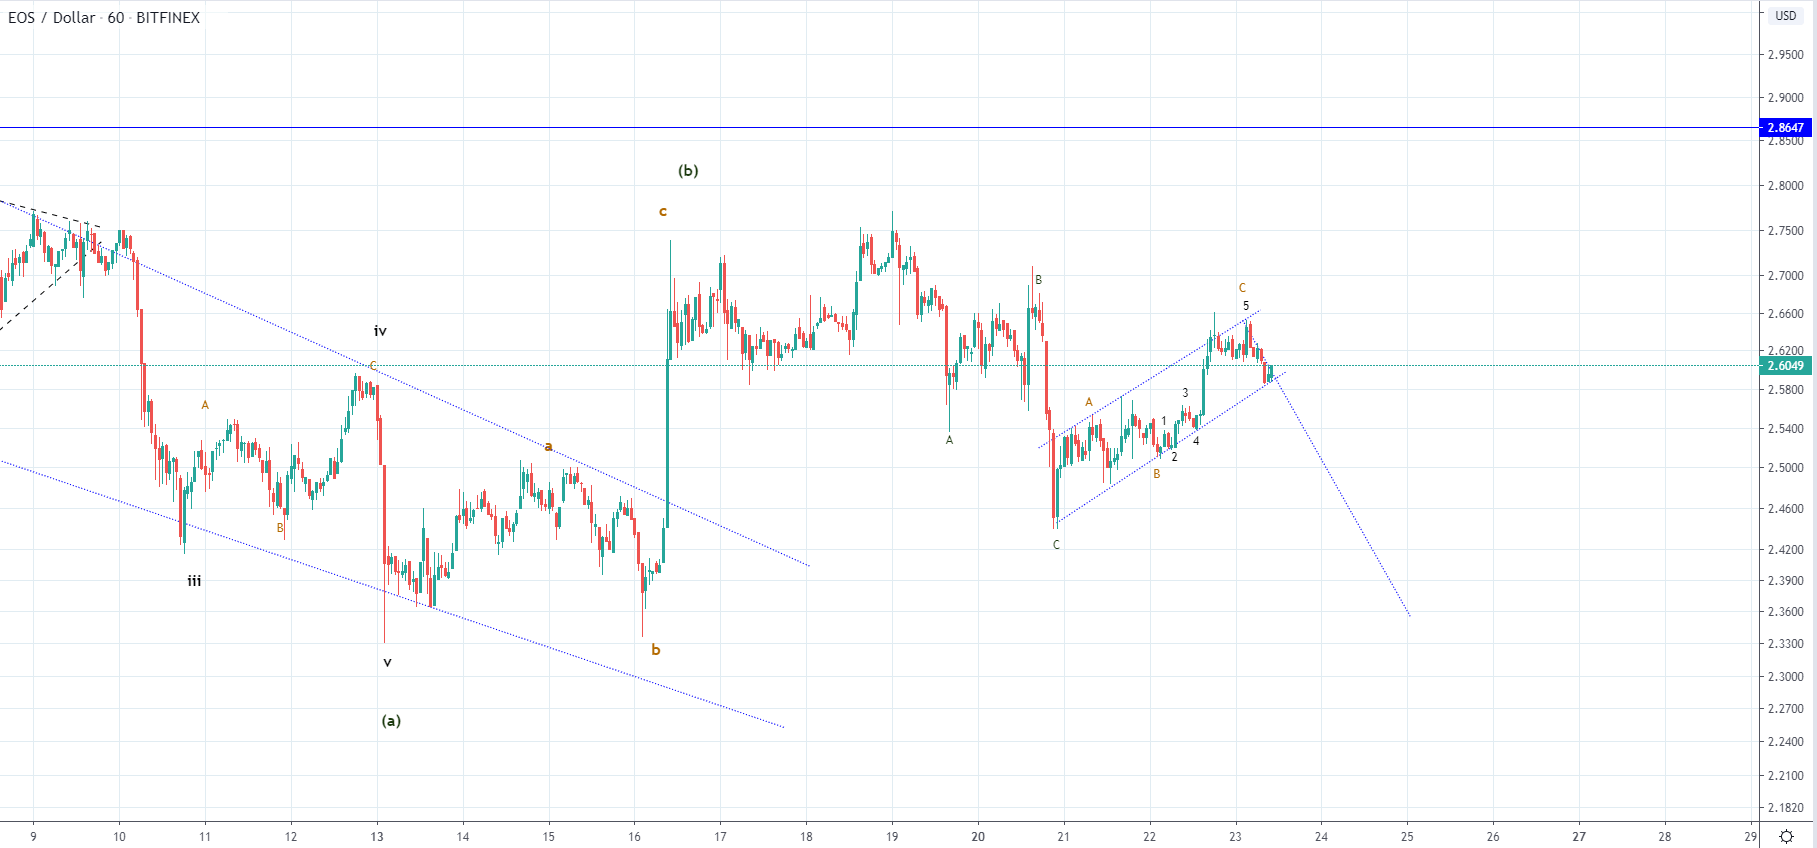
A similar pattern can be seen on the chart of EOS as the price came up in a similar fashion. Price action formed an ascending channel with who’s resistance level we have seen an interaction today that ended as a rejection. This could be the 2nd corrective wave out of the next three-wave move to the downside or could be the next five-wave impulse. Like in the case of Litecoin we are going to look for signs of validation or invalidation, namely territory of the 2nd wave in both directions.
If the price gets above the $2.6 level a bullish possibility would look more likely, but if the starts falling below the $2.4 a bearish one would look more likely.
FXOpen offers the world's most popular cryptocurrency CFDs*, including Bitcoin and Ethereum. Floating spreads, 1:2 leverage — at your service (additional fees may apply). Open your trading account now or learn more about crypto CFD trading with FXOpen.
*Important: At FXOpen UK, Cryptocurrency trading via CFDs is only available to our Professional clients. They are not available for trading by Retail clients. To find out more information about how this may affect you, please get in touch with our team.
This article represents the opinion of the Companies operating under the FXOpen brand only. It is not to be construed as an offer, solicitation, or recommendation with respect to products and services provided by the Companies operating under the FXOpen brand, nor is it to be considered financial advice.
Stay ahead of the market!
Subscribe now to our mailing list and receive the latest market news and insights delivered directly to your inbox.


Latest articles

EUR/USD and GBP/USD consolidate ahead of the Fed decision
European currencies are showing subdued dynamics, entering a consolidation phase following their previous advance. Earlier, EUR/USD and GBP/USD broke out of their ranges and strengthened; however, the subsequent correction has led both pairs to retest the previously breached

Meta: V-Shaped Recovery Meets Heavy Volume Resistance
The movement in Meta Platforms shares is being driven by two competing narratives. On one hand, advertising revenue is benefiting from AI-based tools: the Advantage+ platform continues to support strong advertiser demand, and the analyst consensus for Q1 2026 revenue

Commodity Currencies Test Key Levels Ahead of Major Macro Data
Commodity-linked currencies are trading near key levels, showing restrained price action as market participants adopt a wait-and-see approach. The fundamental backdrop is shaped by expectations surrounding the release of Australia’s inflation data and the Bank of Canada’s interest