


LTC and EOS - Is the increase ending?
FXOpen

LTC/USD
Since the start of the week, the price of Litecoin has been increasing and has come up from $55.84 at it’s lowest point to $62.86 at it’s highest which is an increase of 12.57%. The price is currently being traded around the levels of today’s high but is starting to show the signs of struggle to keep up the upward momentum.
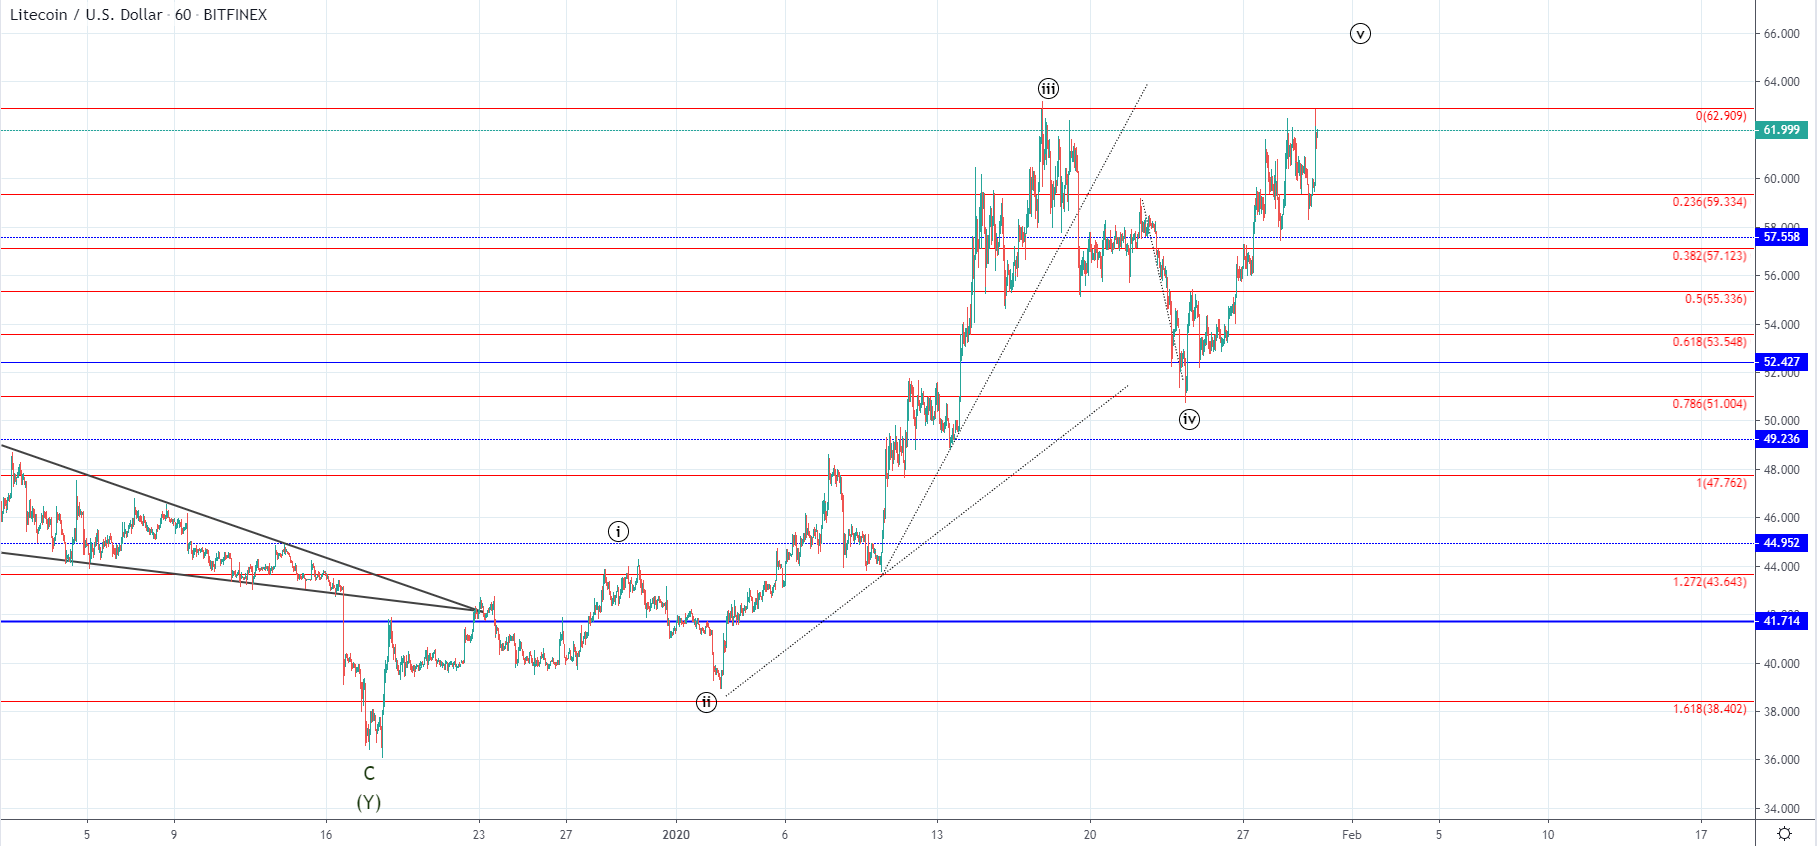 On the hourly chart, you can see that the price today came up to the vicinity of the prior high and has tested the 0 Fibonacci level, finding resistance there on the quick spike to the upside. This indicates that the horizontal level serves as a strong resistance and is likely to continue doing so. After a decrease of 18.8% made last week, ending at the 0.786 Fib level, which is considered the 4th wave out of the five-wave impulse we have seen an increase of 23.13% which could be the 5th wave. As the price came up to the prior high this 5th wave could be completed or it could continue for another attempt and eventually wick above it, but is likely to end soon.
Another possibility would be that the price ended its 5th wave on the 17th of January in which case the current increase could be corrective in nature, but in either way from the current levels we are to see the start of a downside move either as the 2nd wave of the higher degree, or further downtrend continuation if this five-wave impulse was the part of the correction to the upside.
EOS/USD
From Monday’s open at $3.64 the price of EOS has increased by 15.5% as it came up to $4.2 at it’s highest today and is still being traded around those levels. The price is still in an upward trajectory and is indicating bullish action.
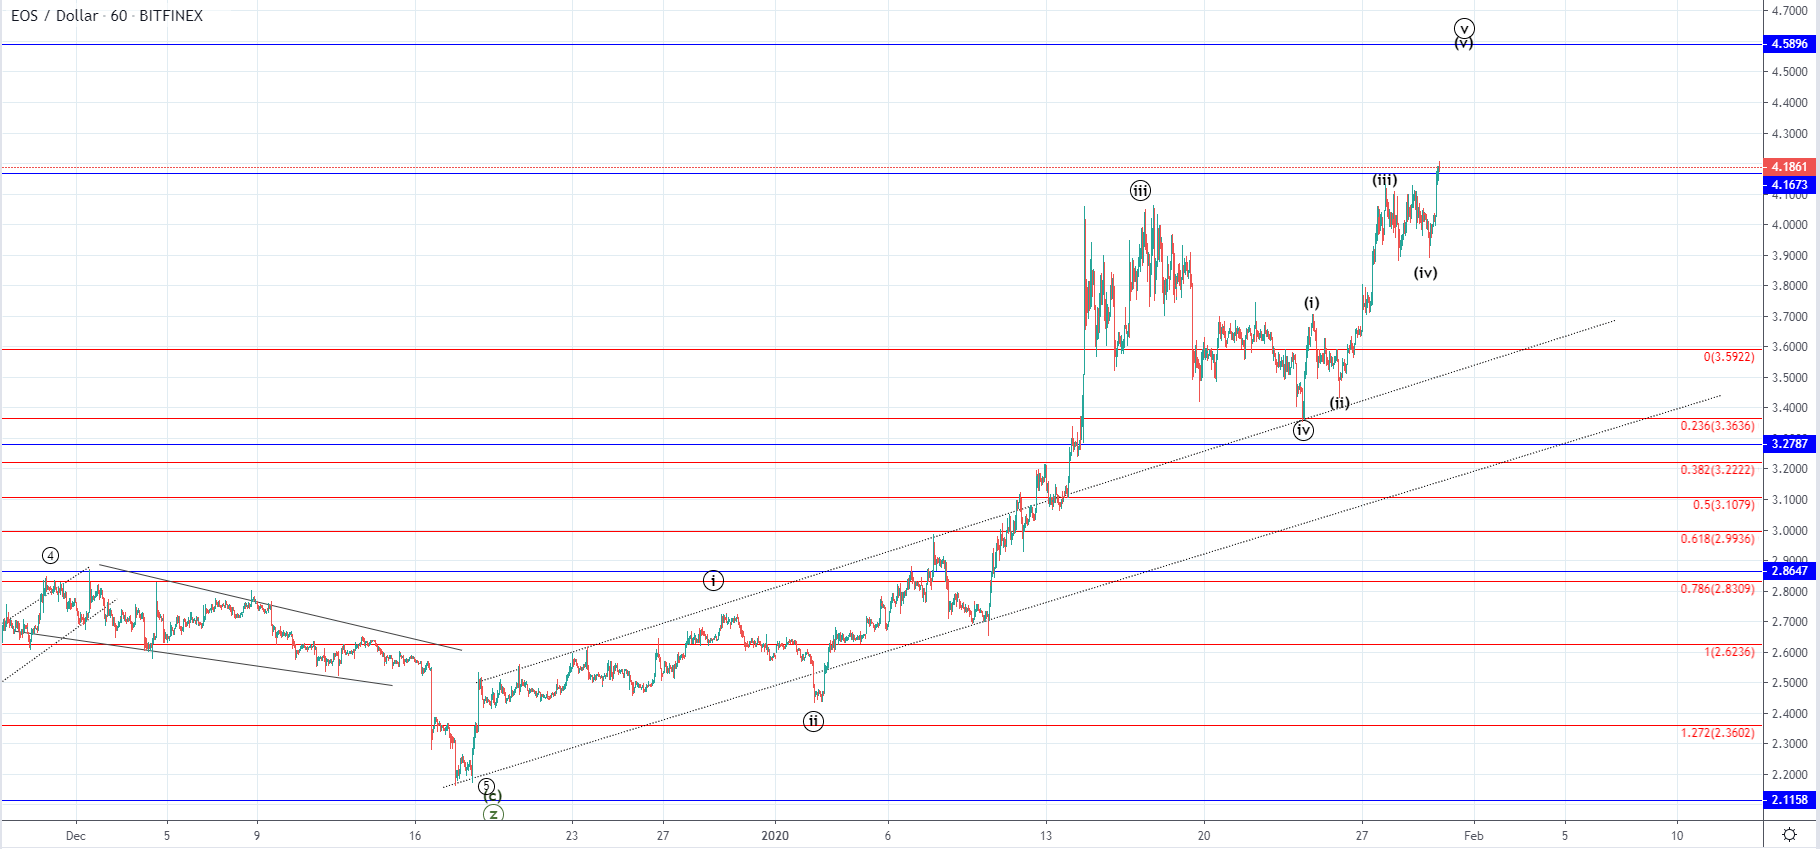 On the hourly chart, you can see that unlike in the case of Litecoin the price of EOS has surpassed the prior high made on the 17th of January but like Litecoin reached the horizontal resistance level close by and is currently retesting it for resistance.
As we have most likely seen the higher degree five-wave impulse from the 17th December last year the increase is soon expected to end, but that doesn’t mean that the price is can’t continue moving to the upside for another 10% as there is still room to go to. The ending wave is most likely developing and considering that it surprised the prior high it might continue to the next horizontal level to the upside which is at $4.6 but that all depends on the current interaction with the horizontal resistance.
FXOpen offers the world's most popular cryptocurrency CFDs*, including Bitcoin and Ethereum. Floating spreads, 1:2 leverage — at your service (additional fees may apply). Open your trading account now or learn more about crypto CFD trading with FXOpen.
*Important: At FXOpen UK, Cryptocurrency trading via CFDs is only available to our Professional clients. They are not available for trading by Retail clients. To find out more information about how this may affect you, please get in touch with our team.
This article represents the opinion of the Companies operating under the FXOpen brand only. It is not to be construed as an offer, solicitation, or recommendation with respect to products and services provided by the Companies operating under the FXOpen brand, nor is it to be considered financial advice.
Stay ahead of the market!
Subscribe now to our mailing list and receive the latest market news and insights delivered directly to your inbox.


Latest articles

EUR/USD Eyes Gains As USD/CHF Weakness Deepens Again
EUR/USD started a fresh increase above 1.1700 and 1.1720. USD/CHF declined further and is now struggling below 0.7835.
Important Takeaways for EUR/USD and USD/CHF Analysis Today
· The Euro started a decent increase from

Apple: Earnings Day Above the Activity Zone
On 30 April, after the market close, Apple Inc. will release its financial results for the second quarter of fiscal 2026. The consensus forecast, based on estimates from 31 analysts, points to revenue of around $109.7 billion, with expected

USD/JPY and USD/CHF Near Key Levels: The Dollar Supported by the Fed
The US dollar continues to trend upwards following the Federal Reserve meeting, drawing support from the regulator’s moderately hawkish stance and comments by Jerome Powell. Markets interpret the Fed’s rhetoric as a signal that restrictive policy is likely