


LTC and EOS - Lost over 35% in a day but a recovery soon expected
FXOpen

LTC/USD
On today’s open the price of Litecoin has been sitting at $49.139 but fell from there to $31.584 at it’s lowest point today which is a decrease of 35.72%. As the price is still in a downward trajectory further lows could be seen by the end of today’s trading session.
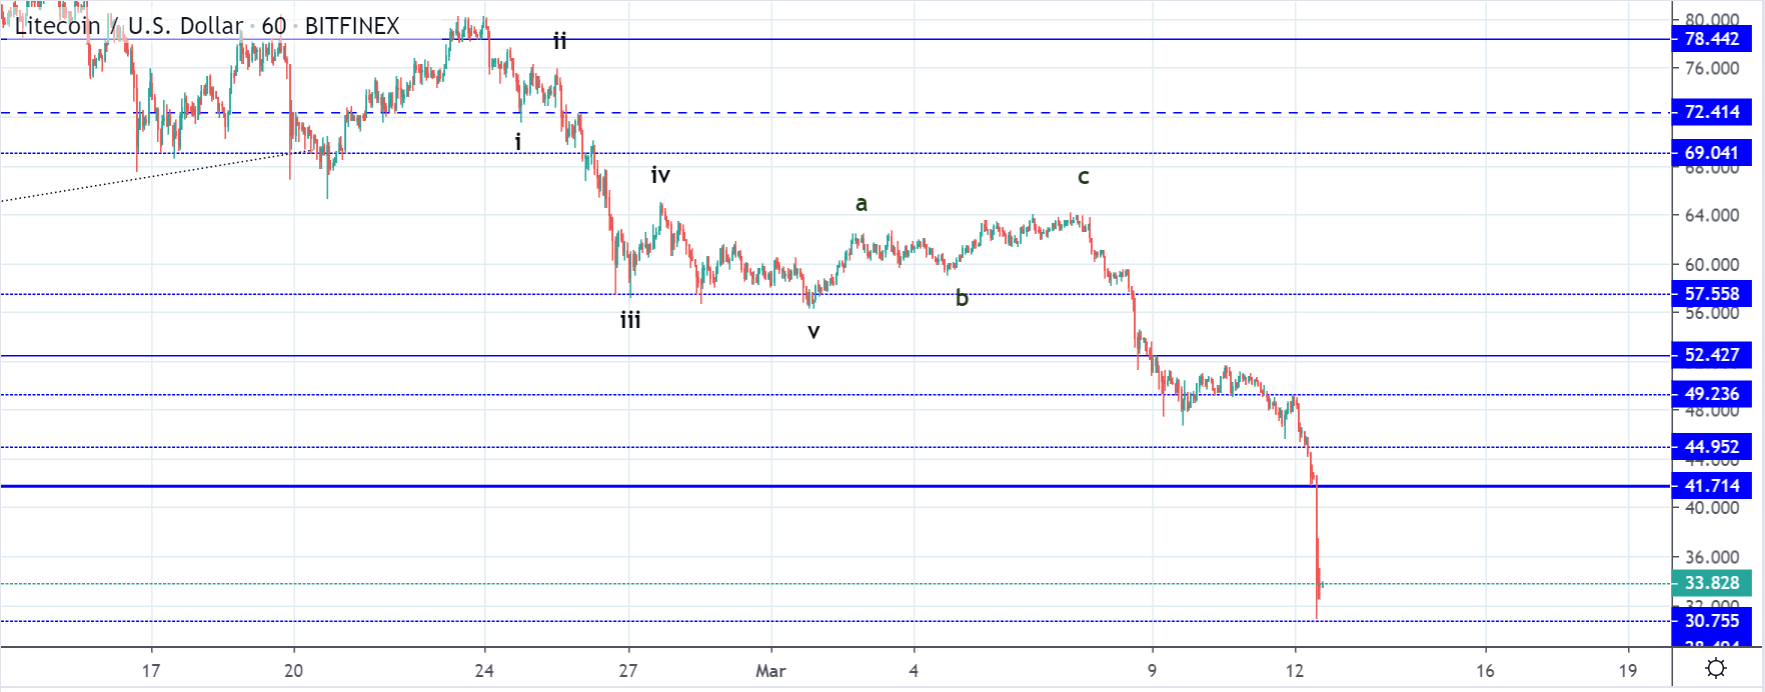 On the hourly chart, we can see that the price continued moving to the downside after an attempt to recover but it only ended as another ABC correction of a lower degree to the upside. The downfall that developed was presumed to be the ending wave but this is was invalidated by the downfall made from the 7th till the 9th of March and now confirmed by the impulsive drop.
This impulsive drop in combination with the prior ABC to the downside are most likely 4th and the 5th wave out of the impulsive decrease of a higher degree which is different than previously labeled ABC correction. As we have seen two more waves developing it could only mean that the structure hasn’t been corrective but an impulsive one.
The impulsive five-wave move to the downside could be a wave of a corrective structure from a higher degree but that would only mean that the price of Litecoin is headed into further sideways and descending moves before the end of this prolonged correction.
As you see a decrease was made to the significant horizontal support level at $30.75 but this level isn’t as significant which is why we could be seeing a temporary bounce. In either way, further establishment of support would be expected.
EOS/USD
Similarly like in the case of Litecoin, the price of EOS has also made a significant decrease today, coming from $3.1 at the open to $1.9 at it’s lowest which is a decrease of 38.61%.
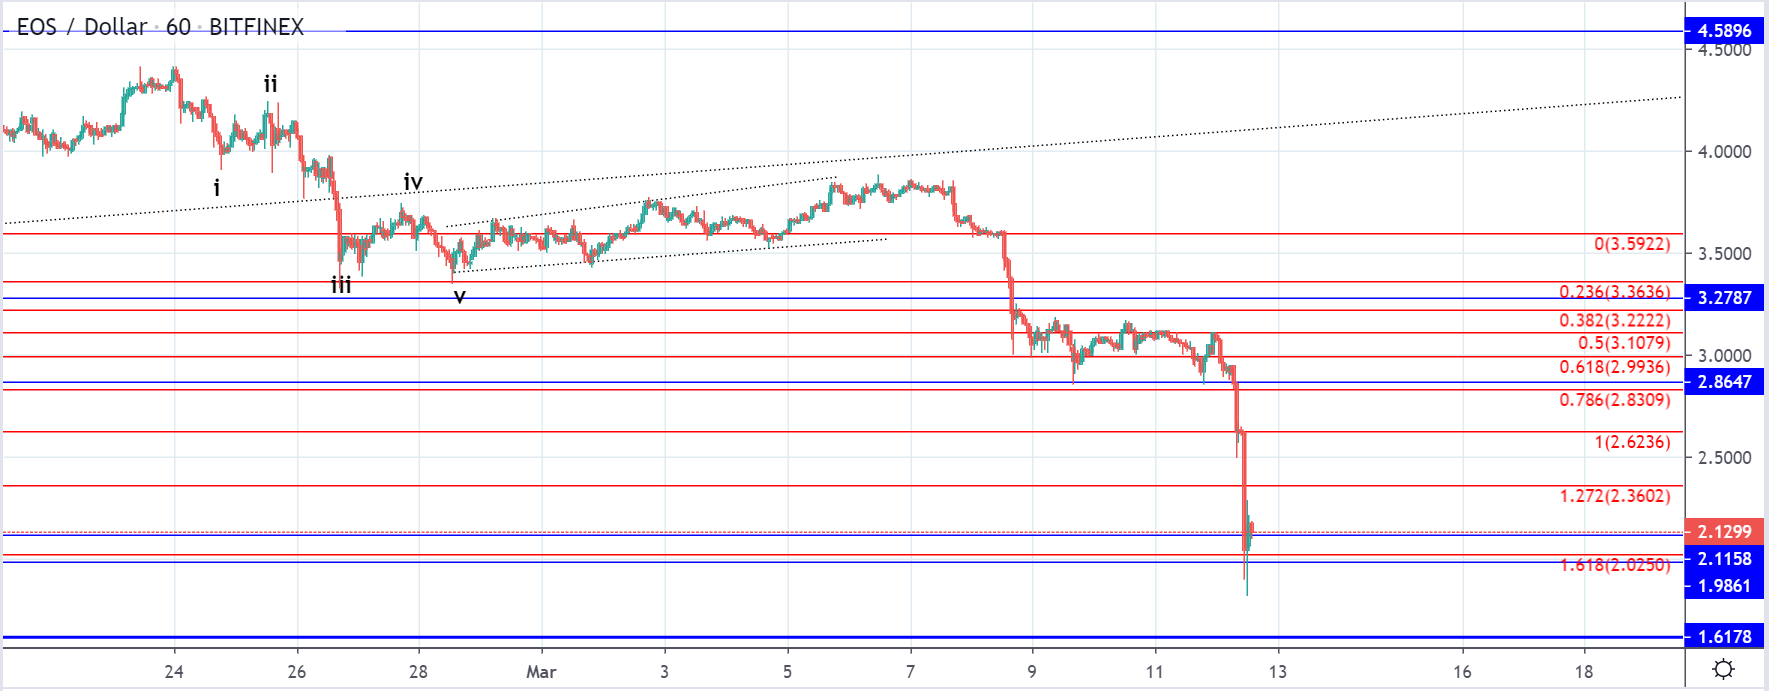 On the hourly chart, we can see that rejection at the 0.5 Fib level has caused a significant downturn with the price headed to the 1.618 where it found support. The wick on the buyer’s side indicates that the price reached buyers’ territory but the bearish momentum is strong which is why we could have seen a temporary stop before a further decline.
If the price starts increasing from here it could mean that we have seen the end of the impulsive five-wave move to the downside, like in the case of Litecoin, but if the horizontal support gets broken further decrease would be expected.
In the upcoming period, we are likely to see sideways movement with support lookout.
FXOpen offers the world's most popular cryptocurrency CFDs*, including Bitcoin and Ethereum. Floating spreads, 1:2 leverage — at your service (additional fees may apply). Open your trading account now or learn more about crypto CFD trading with FXOpen.
*Important: At FXOpen UK, Cryptocurrency trading via CFDs is only available to our Professional clients. They are not available for trading by Retail clients. To find out more information about how this may affect you, please get in touch with our team.
This article represents the opinion of the Companies operating under the FXOpen brand only. It is not to be construed as an offer, solicitation, or recommendation with respect to products and services provided by the Companies operating under the FXOpen brand, nor is it to be considered financial advice.
Stay ahead of the market!
Subscribe now to our mailing list and receive the latest market news and insights delivered directly to your inbox.


Latest articles

EUR/USD Eyes Gains As USD/CHF Weakness Deepens Again
EUR/USD started a fresh increase above 1.1700 and 1.1720. USD/CHF declined further and is now struggling below 0.7835.
Important Takeaways for EUR/USD and USD/CHF Analysis Today
· The Euro started a decent increase from

Apple: Earnings Day Above the Activity Zone
On 30 April, after the market close, Apple Inc. will release its financial results for the second quarter of fiscal 2026. The consensus forecast, based on estimates from 31 analysts, points to revenue of around $109.7 billion, with expected

USD/JPY and USD/CHF Near Key Levels: The Dollar Supported by the Fed
The US dollar continues to trend upwards following the Federal Reserve meeting, drawing support from the regulator’s moderately hawkish stance and comments by Jerome Powell. Markets interpret the Fed’s rhetoric as a signal that restrictive policy is likely