


FXOpen
LTC/USD
On Monday’s open the price of Litecoin was sitting at around $80 which was the exact ending point of the recovery to the upside as from there the price decreased in an impulsive manner to $57.58 at it’s lowest point today which is a 28.1% depreciation.
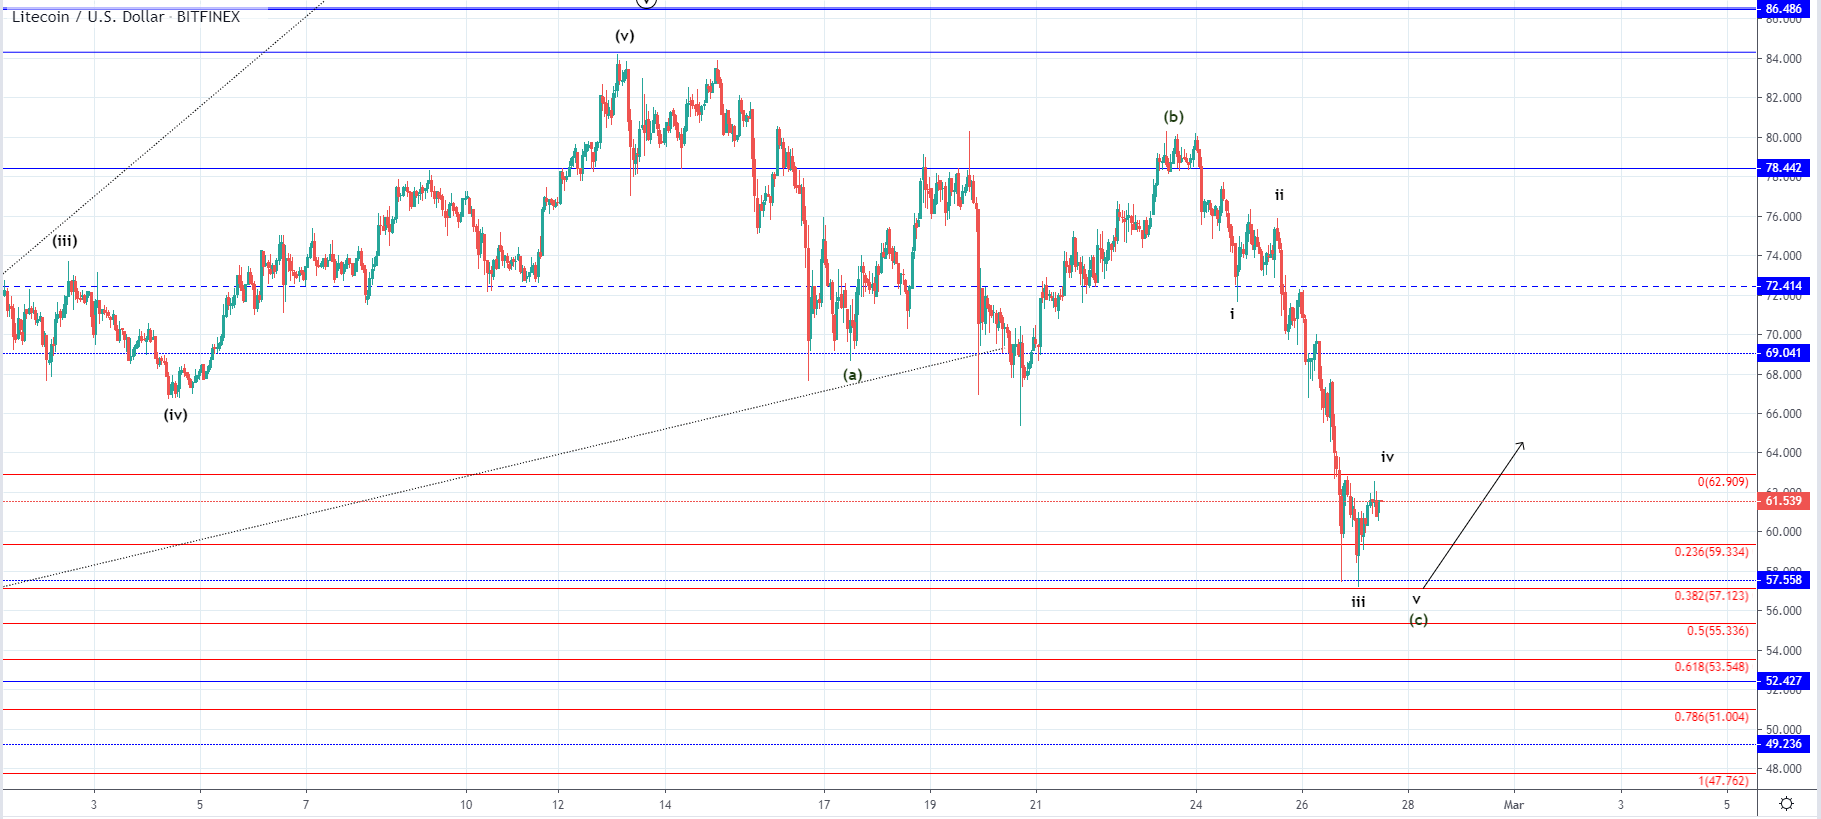 As you can see from looking at the hourly chart, Monday’s open was at the presumed B wave from the ABC correction that started after an interaction with the $84.2 horizontal level on the 13th of February. We have seen the completion of the five-wave impulse to the upside which is now we are seeing the three-wave correction to the downside.
Considering the last wave we have most likely seen the completion of the 3rd wave from the lower degree count and now we are seeing the development of the 4th which can continue moving the price in a sideways movement before another retest of the 0.382 Fibonacci level with whom an interaction has been made on today’s low. As this would be the ending wave of the lower degree count it could mean that the C wave from a higher degree would end as well.
If we have seen a three-wave ABC correction to the downside, after further support establishment around $57.1 another recovery of a higher degree could be expected.
EOS/USD
The price of EOS has also been decreasing impulsively from Mondays open at $4.41 which is it’s highest point of the week at $3.42, made today. This decrease of 22.44% has starting to look like completed as a minor recovery has been made with the price currently being traded at $3.57
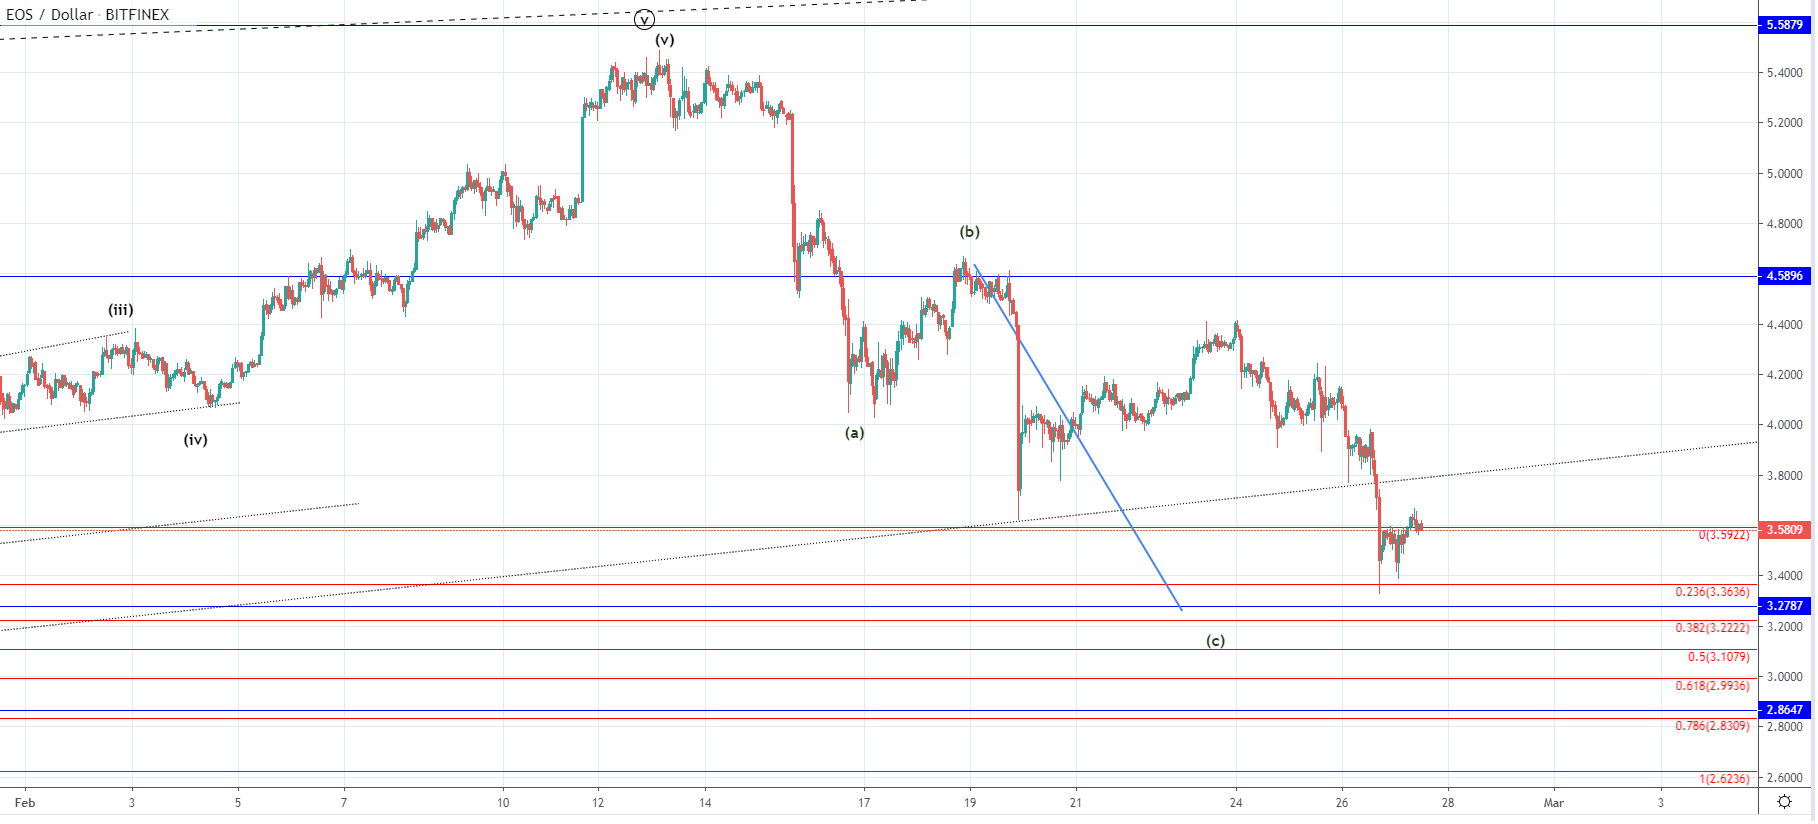 On the hourly chart, you can see that the price of EOS fell below the significant starting Fibonacci level and tested the 0.236 one with a quick spike. As it looks like the buying was activated by this movement a minor recovery of around 6% has been made with the price attempting to find support on the 0 Fib level from the upper side.
If the price finds support here it could indicate that we have seen the end of the decrease and the C wave of the Zigzag correction to the downside, but this might be the 4th wave out of the lower degree count similarly like in the case of Litecoin. This is why the 0 Fib level interaction can provide an early indication of further price progression.
But if the price gets rejected at the current levels we have likely to see another lower low, potentially to the $3.27 level which is the projected length of the wave A.
FXOpen offers the world's most popular cryptocurrency CFDs*, including Bitcoin and Ethereum. Floating spreads, 1:2 leverage — at your service. Open your trading account now or learn more about crypto CFD trading with FXOpen.
*At FXOpen UK and FXOpen AU, Cryptocurrency CFDs are only available for trading by those clients categorised as Professional clients under FCA Rules and Professional clients under ASIC Rules respectively. They are not available for trading by Retail clients.
This article represents the opinion of the Companies operating under the FXOpen brand only. It is not to be construed as an offer, solicitation, or recommendation with respect to products and services provided by the Companies operating under the FXOpen brand, nor is it to be considered financial advice.
Stay ahead of the market!
Subscribe now to our mailing list and receive the latest market news and insights delivered directly to your inbox.

Latest articles

Weekly Market Wrap With Gary Thomson: Nasdaq, EUR/USD, USD/CHF, Brent Crude Oil, Googl Shares
Get the latest scoop on the week's hottest headlines, all in one convenient video. Join Gary Thomson, the COO of FXOpen UK, as he breaks down the most significant news reports and shares his expert insights.
- Nasdaq Composite: Worst Session

Analysis of AUD/USD: Exchange Rate Falls to Early May Low
As indicated by the 4-hour AUD/USD chart today:
→ the rate fell below 0.652, a level last seen on May 2;
→ the RSI indicator dropped below 15, a level last seen during the panic over the spread of COVID-19

Analysis of AMZN Stock: Price at 1.5-Month Low
As shown in the AMZN chart, the stock price dropped below:
→ the psychological level of $180;
→ the mid-June interim low.
The last time AMZN traded below $180 was in early June.
Thus, AMZN has faced sell-offs, similar to other tech