


LTC and EOS - Massive Spike Seen But Could Still Be Corrective
FXOpen

LTC/USD
Today the price of Litecoin was $38.31 at it’s lowest point but as it made a quick dip to the downside we have seen buying being activated in a strong momentum. The price reached $44.2 at it’s highest point which was an increase of 15.4% but is now starting to decline and is currently sitting just below $43.4.
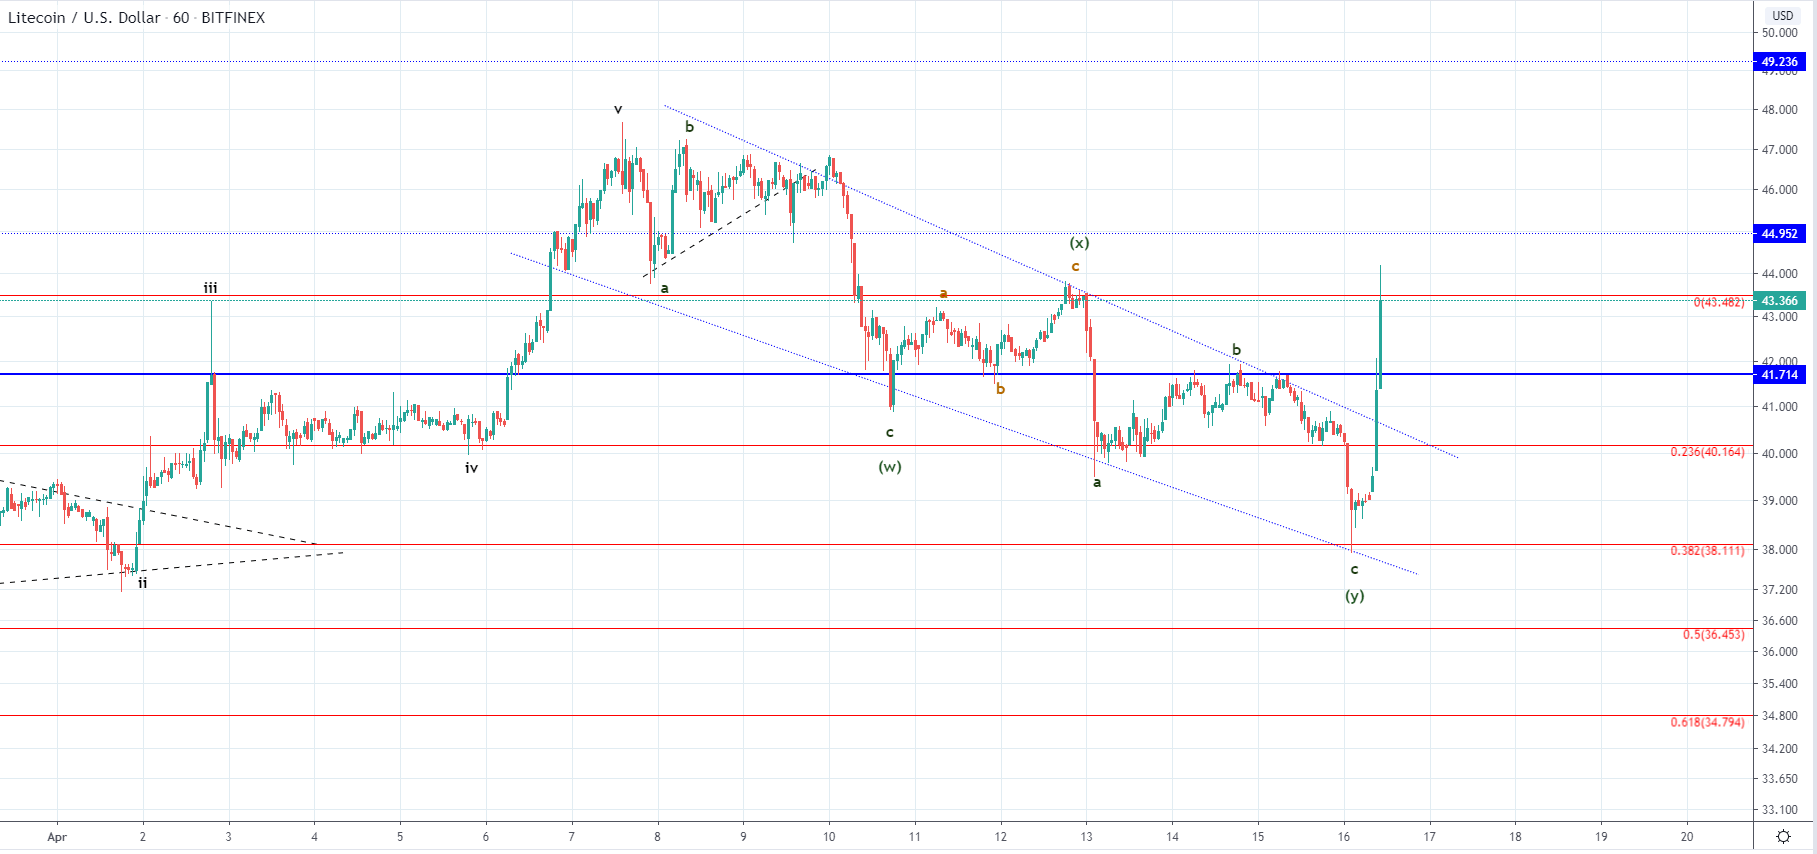 On the hourly chart, you can see that the price previously retested the 0.382 Fibonacci level but left a large wick on the hourly candle as it immediately started increasing from there. A breakout from the descending channels with a higher high being made to the vicinity of the once before it. As we have seen a corrective structure in a descending channel the breakout made could be the uptrend continuation of the five-wave increase of a higher degree.
Looking at the wave structure inside the descending channel it could have been a complex correction sub divided intro three consecutive ABC corrections. If that is the case then it ended on the interaction with the 0.382 Fib level, but it doesn’t seem like this should be counted in the outlined manner. More likely we have seen a five-wave impulse ending on the 0.236 Fib level in which case the upward move to the $41.7 horizontal resistance followed by the retest of the 0.382 Fib level and now the move to the upside would be an upward ABC correction. This is especially considering the amount of increase that we have seen which isn’t typical for the 1st wave of the starting impulse.
If the second is true then this was the completion of the 2nd wave from the higher degree out of either three-wave correction or an impulse wave altogether which will be illustrated on the EOS chart.
EOS/USD
From today’s low at $2.35 the price of EOS has increased by 16.25% coming to $2.732 at it’s highest point. Currently, it is being traded slightly lower at $2.6835 but is still above it’s second prior high unlike in the case of Litecoin.
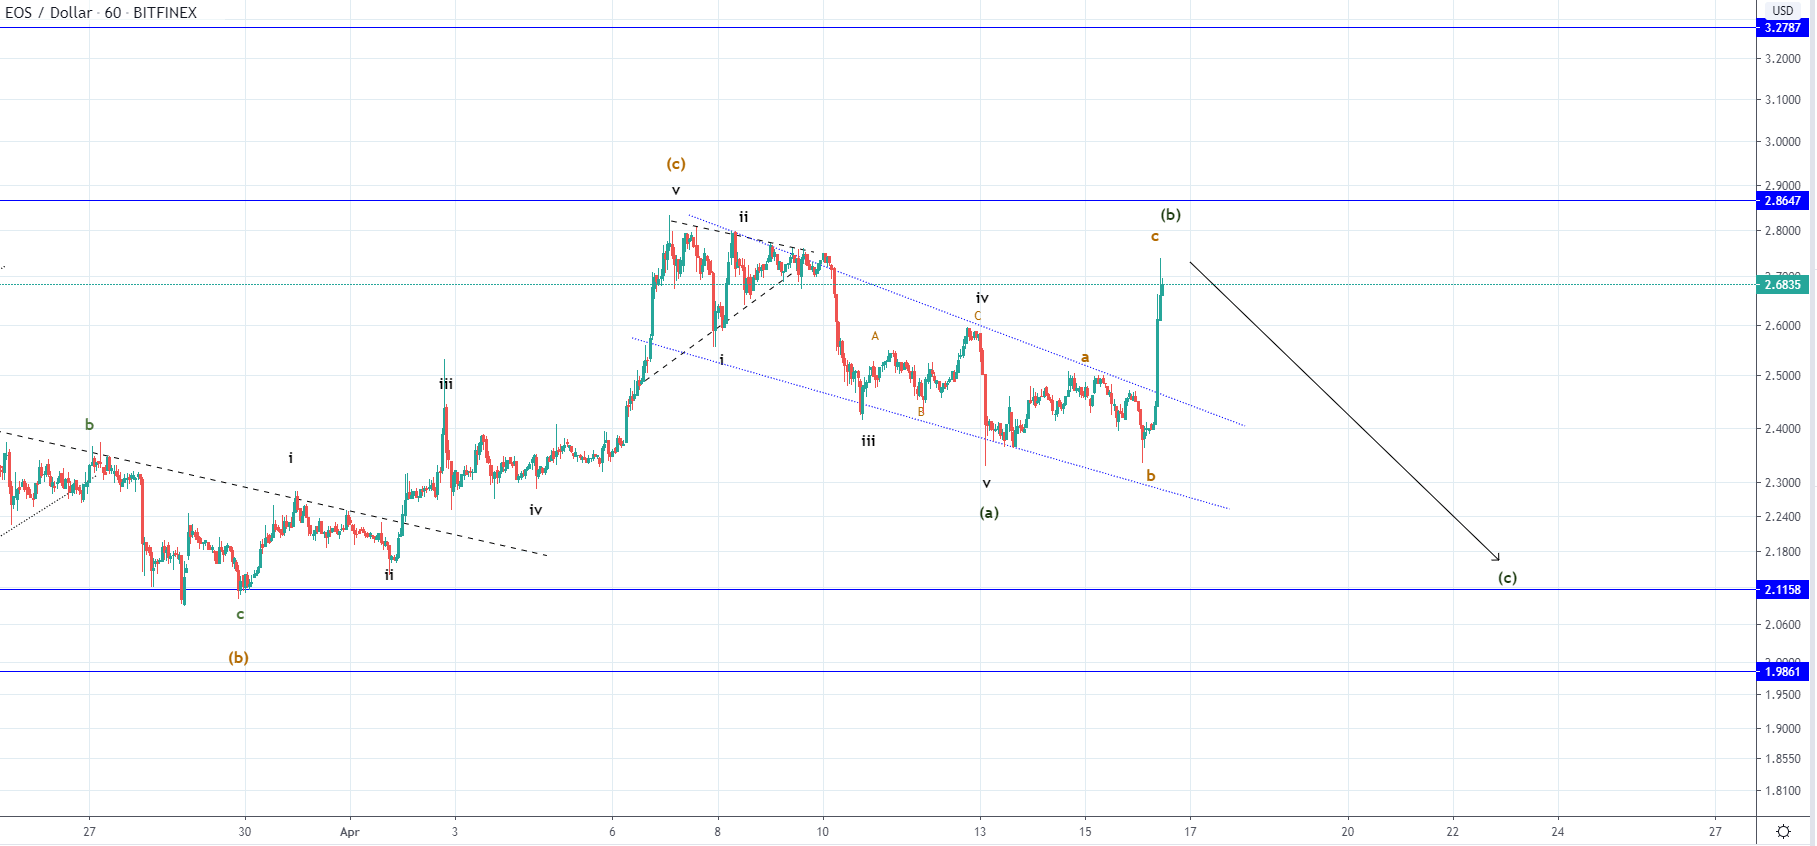
On the hourly chart of EOS I have outlined the different possibility and in my mind a more likely one, namely that today’s increase is the C wave rather the first wave from the next starting impulse. As you can see these labels are implying that from the $2.83 high we have seen a five-wave move that formed a descending channel, followed by an ABC correction to the upside. If this is the case then from here we are to see at least another five-wave move in which case this would end as an ABC of a higher degree. But at most, we could see a five-wave impulse out of which today’s increase would have been the ending point of its 2nd wave.
If the prices continue moving past April’s high this possibility would be invalidated as the 2nd wave cannot go beyond the starting point of the 1st one. But if the price immediately starts decreasing from here and goes below today’s lowest then this possibility would be confirmed.
FXOpen offers the world's most popular cryptocurrency CFDs*, including Bitcoin and Ethereum. Floating spreads, 1:2 leverage — at your service (additional fees may apply). Open your trading account now or learn more about crypto CFD trading with FXOpen.
*Important: At FXOpen UK, Cryptocurrency trading via CFDs is only available to our Professional clients. They are not available for trading by Retail clients. To find out more information about how this may affect you, please get in touch with our team.
This article represents the opinion of the Companies operating under the FXOpen brand only. It is not to be construed as an offer, solicitation, or recommendation with respect to products and services provided by the Companies operating under the FXOpen brand, nor is it to be considered financial advice.
Stay ahead of the market!
Subscribe now to our mailing list and receive the latest market news and insights delivered directly to your inbox.


Latest articles

US Dollar Strengthens Amid Equity Market Weakness and Hawkish Fed Rhetoric
The US dollar continues to hold firm near multi-year highs as sentiment across equity markets deteriorates and investors increasingly expect the Federal Reserve to maintain a restrictive monetary policy stance for longer. The US economy remains resilient, while inflation risks

Bitcoin: Corrective Channel Broken as Traders Turn More Active
Bitcoin has come under the influence of several factors simultaneously. The wave of selling at the beginning of June was linked to Strategy's first disclosed Bitcoin sale in several years, a prolonged series of outflows from spot ETFs, and a

DAX 40: consolidation amid technology sell-off
A wave of selling in the technology sector that emerged earlier this week has weighed on European equities. The trigger was investor concern over the profitability of large-scale debt-funded investments by major US tech companies in AI infrastructure. The Nasdaq