


LTC and EOS - More upside expected
FXOpen

LTC/USD
The price of Litecoin has increased by 10.56% from its lowest point on Monday at $41.46 measured to its highest point made today which was at $45.847 but the price only spiked to those levels and has pulled back immediately to $44.7. Since then another upside move has been made with the price currently being traded at $45.257 and is in an upward trajectory.
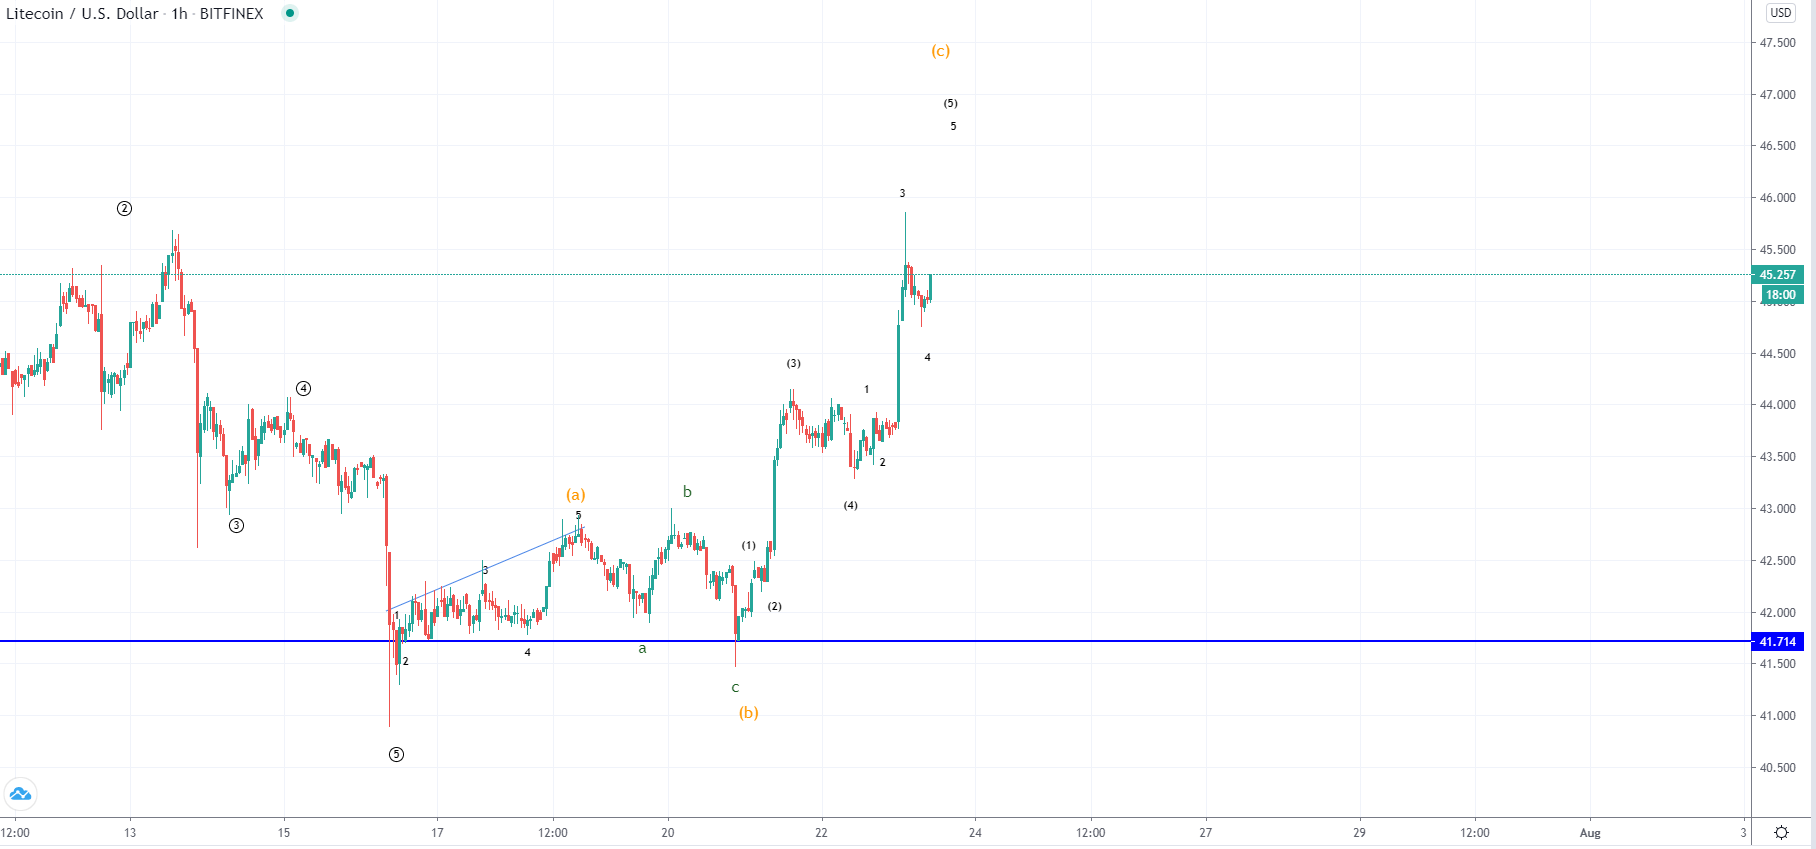
On the hourly chart, you can see that the price of Litecoin has been increasing parabolically and impulsively after an interaction with the $41.714 horizontal support level which was retested on Monday and on the 16th of July. As the price was attempted to be pushed below the level the bulls took control and the buying pressure was activated which is why we have seen it causing another round of buying.
However, the price has come to the levels of the prior high of a higher degree from which the previous impulsive downside move has been made and wasn’t able to surpass it. This might change in the upcoming period as by looking at the wave structure it appears that the price is headed further to the upside for a bit more for the development of the 5th wave. As the price is currently in an upward trajectory we could be seeing the start of the 5th wave, but more likely this is still the part of the corrective 4th wave move that is going to last for a bit more in order for consolidation to occur before another impulsive move.
EOS/USD
The price of EOS has made its significant low on Sunday at around $2.48 level and from there started increasing impulsively to the upside with strong bullish momentum and reached $2.68 at its highest point which was an increase of 8.27%. Looking at the hourly chart below, we can see that the price is currently retesting the 0.786 Fibonacci level as it went slightly below it but is now looking for signs of support.
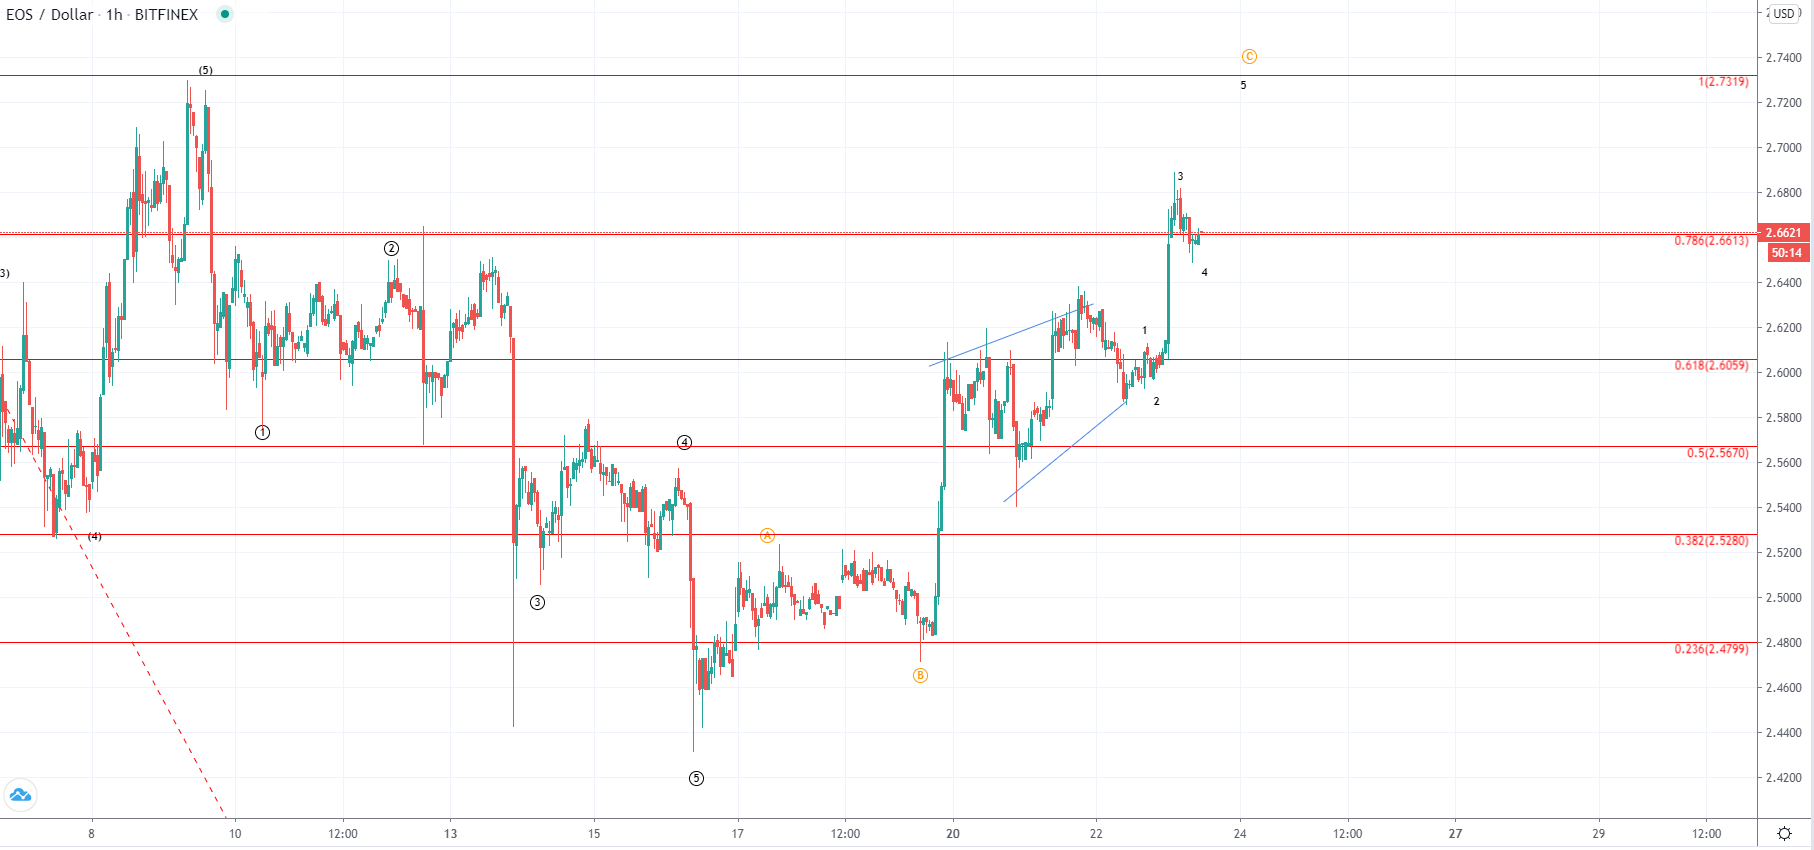
Like in the case of Litecoin we have seen the development of the 3rd wave of a lower degree count which is why more upside would be expected from here but the current price action is likely first going to develop the 4th one as we have seen a retracement back below the significant Fib level. If this is true another minor move to the downside would be expected from here which is likely to test the $2.64 horizontal resistance level but after it ends a move to the 1 Fib level is likely to be seen which would bring the price back up to $2.7319
FXOpen offers the world's most popular cryptocurrency CFDs*, including Bitcoin and Ethereum. Floating spreads, 1:2 leverage — at your service (additional fees may apply). Open your trading account now or learn more about crypto CFD trading with FXOpen.
*Important: At FXOpen UK, Cryptocurrency trading via CFDs is only available to our Professional clients. They are not available for trading by Retail clients. To find out more information about how this may affect you, please get in touch with our team.
This article represents the opinion of the Companies operating under the FXOpen brand only. It is not to be construed as an offer, solicitation, or recommendation with respect to products and services provided by the Companies operating under the FXOpen brand, nor is it to be considered financial advice.
Stay ahead of the market!
Subscribe now to our mailing list and receive the latest market news and insights delivered directly to your inbox.


Latest articles

US Dollar Index: A Defining Week for the King of the Markets
The dollar heads into a pivotal week trading near 101.80, just off a 15-month high, with the Fed's July 29 meeting standing as the clear focal point. Markets currently price roughly a 65% chance of a hold, though renewed

NZD/USD: Inflation Surge Meets Strong US Dollar Pressure
On 21 July, Stats NZ reported an acceleration in inflation: the Consumer Price Index rose 1.5% in the second quarter, while the annual inflation rate climbed to 4.1%, its highest level in more than two years and slightly

Weekly Market Insights with Gary Thomson: The Week of Central Banks and Earnings
In this video, we’ll explore the key economic events and market trends, shaping the financial landscape. Get ready for insights into financial markets to help you navigate the week ahead. Let’s dive in!
In this episode of Market