


FXOpen

LTC/USD
The price of Litecoin has been in a decline from today’s open at $159 which was its highest point so far. It made a decrease of 9.67% at its lowest today but is currently being traded slightly high at is sitting at around $149.11.
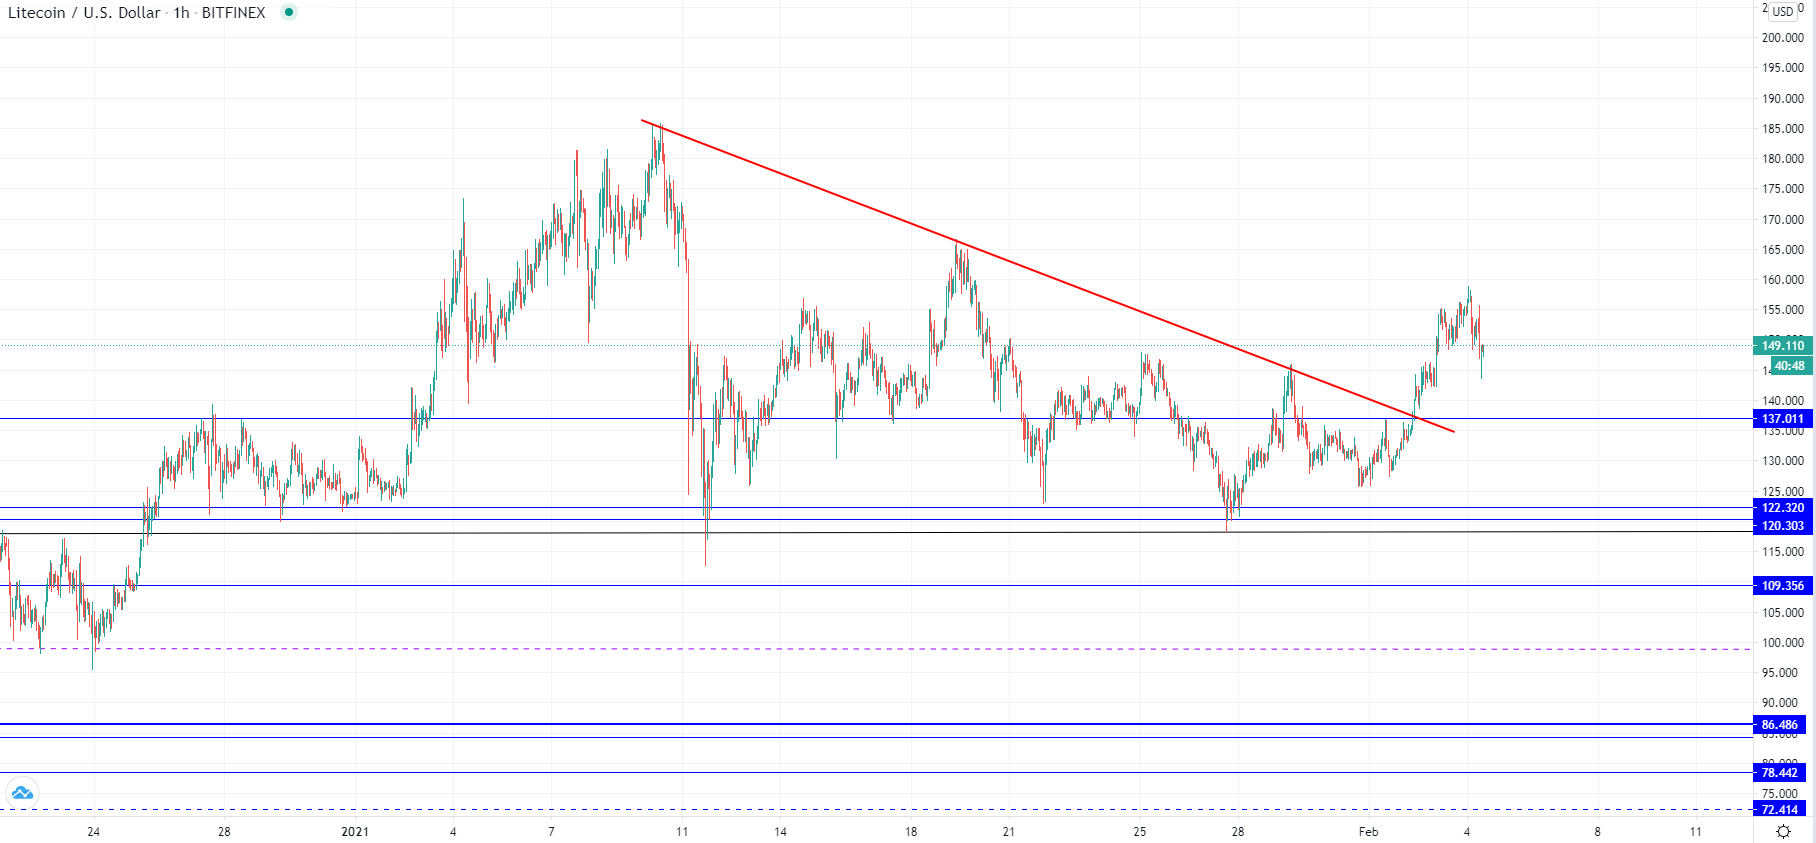
On the hourly chart, you can see that today’s open the high made after a breakout from the descending triangle in which the price was since the 10th of January. The price fell from its high of $185.8 to the horizontal support level at $122 on three occasions and after the third test, a higher high was made and then finally a breakout to the upside on Tuesday. As the price continued making a higher high it exceeded the $155 horizontal level which was the mid-range of the correctional structure in the descending triangle but failed to go above the midpoint high at $166.7 before making a pullback.
If the prior correction ended with the breakout being the continuation of the uptrend of the higher degree, then the current retracement would be only a local one. In that case from the 27th of January when another retest of the significant horizontal level at the $120 zone was made we have seen the start of the next five-wave impulse with the breakout wave being its 3rd. Now as the price is going to the downside it should find support on the ending point of the assumed 1st wave which is at $146. This was tested today with the price action showing a wick on the hourly chart it appears that support is present at those level.
However if the price continues to move further to the downside it could mean that this increase seen with a breakout to the upside was the continuation of the corrective count.
EOS/USD
From its highest point on Monday at $3.2787, the price of EOS has fallen by 11.75% on the same day and enter a recovery since. It reached $3.15 yesterday which could have been the end of the recovery as it started decreasing again and is currently being traded just above $3.
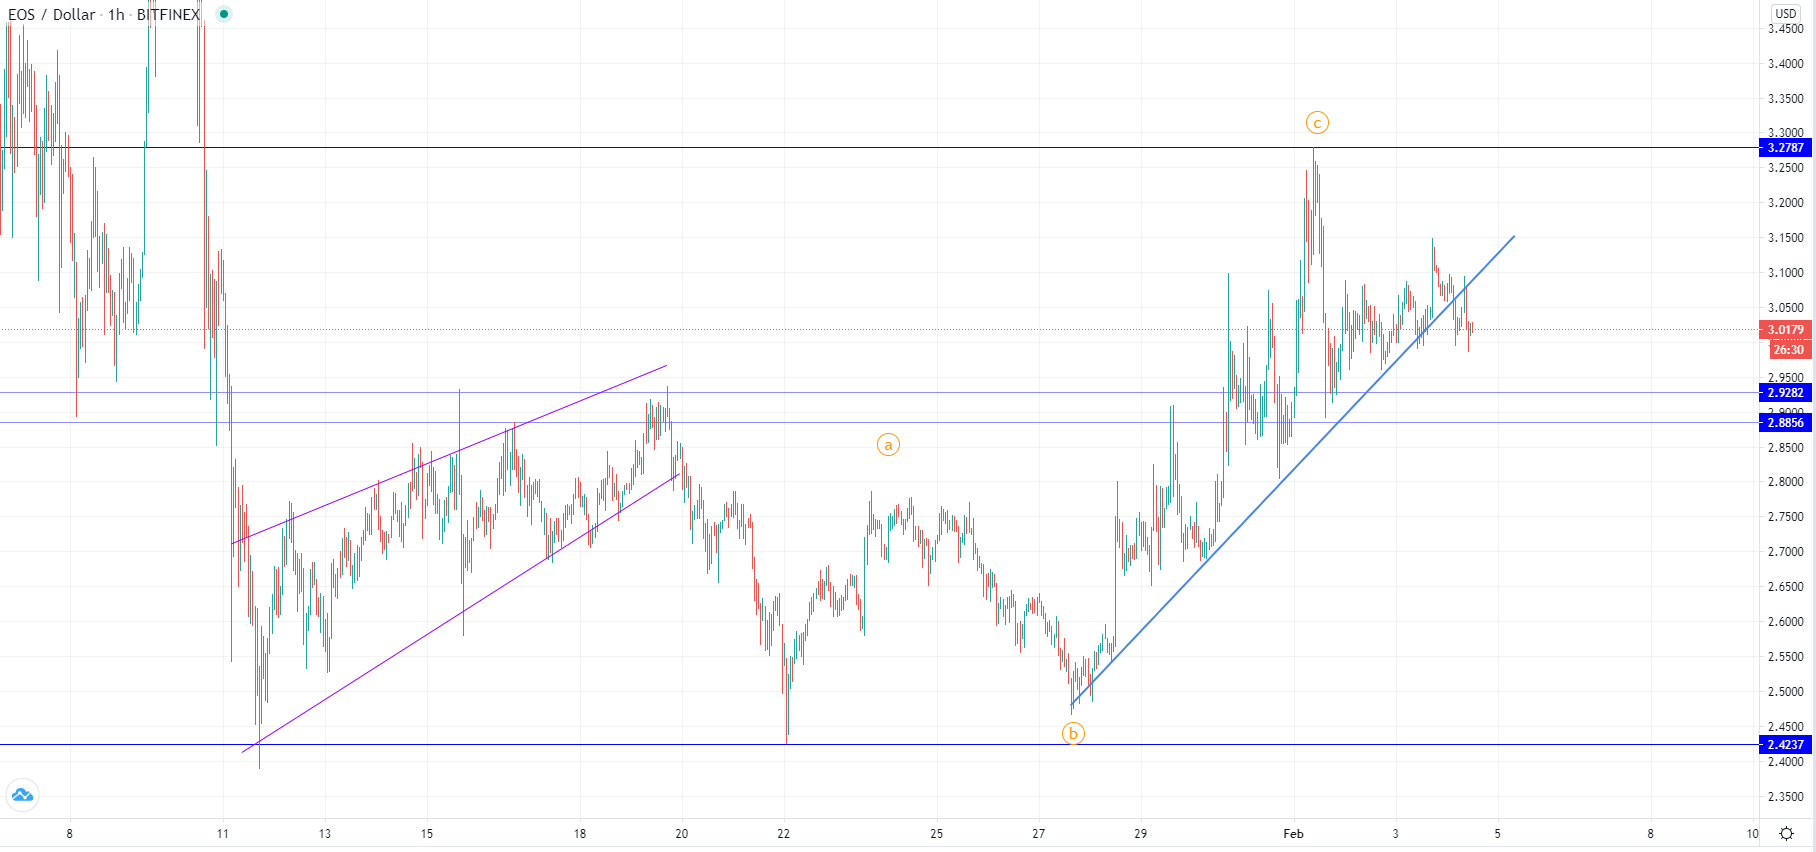
As you can see from the hourly chart the price made a breakout below its ascending trendline that dates from the 27th of January. This ascending trendline is the 3rd wave from the upward move that starts on the 22nd of January, but it is still unclear whether or not it is an impulse or a corrective count. Judging by the wave personality it looks more corrective at this point which is why I’ve labeled it as an ABC. This is soon going to be validated as if the price continued moving to the downside below the $2.88 zone it could very well mean that we have seen the correctional ABC count.
This forecast represents FXOpen Markets Limited opinion only, it should not be construed as an offer, invitation or recommendation in respect to FXOpen Markets Limited products and services or as financial advice.
Cryptocurrency CFDs are not available to trade in all jurisdictions.
FXOpen offers the world's most popular cryptocurrency CFDs*, including Bitcoin and Ethereum. Floating spreads, 1:2 leverage — at your service. Open your trading account now or learn more about crypto CFD trading with FXOpen.
*At FXOpen UK and FXOpen AU, Cryptocurrency CFDs are only available for trading by those clients categorised as Professional clients under FCA Rules and Professional clients under ASIC Rules respectively. They are not available for trading by Retail clients.
This article represents the opinion of the Companies operating under the FXOpen brand only. It is not to be construed as an offer, solicitation, or recommendation with respect to products and services provided by the Companies operating under the FXOpen brand, nor is it to be considered financial advice.
Stay ahead of the market!
Subscribe now to our mailing list and receive the latest market news and insights delivered directly to your inbox.

Latest articles

Weekly Market Wrap With Gary Thomson: Nasdaq, EUR/USD, USD/CHF, Brent Crude Oil, Googl Shares
Get the latest scoop on the week's hottest headlines, all in one convenient video. Join Gary Thomson, the COO of FXOpen UK, as he breaks down the most significant news reports and shares his expert insights.
- Nasdaq Composite: Worst Session

Analysis of AUD/USD: Exchange Rate Falls to Early May Low
As indicated by the 4-hour AUD/USD chart today:
→ the rate fell below 0.652, a level last seen on May 2;
→ the RSI indicator dropped below 15, a level last seen during the panic over the spread of COVID-19

Analysis of AMZN Stock: Price at 1.5-Month Low
As shown in the AMZN chart, the stock price dropped below:
→ the psychological level of $180;
→ the mid-June interim low.
The last time AMZN traded below $180 was in early June.
Thus, AMZN has faced sell-offs, similar to other tech