


LTC and EOS - Resistance seen but for how long?
FXOpen

LTC/USD
The price of Litecoin has been increasing in the past week, and from last Thursday when it was sitting at $141.27 at its lowest, we have seen an increase of 37.8$ measured to its highest point yesterday at $194.31. Since then the price made a pullback to $170.54 but is again back in an upward trajectory, currently sitting at $188.
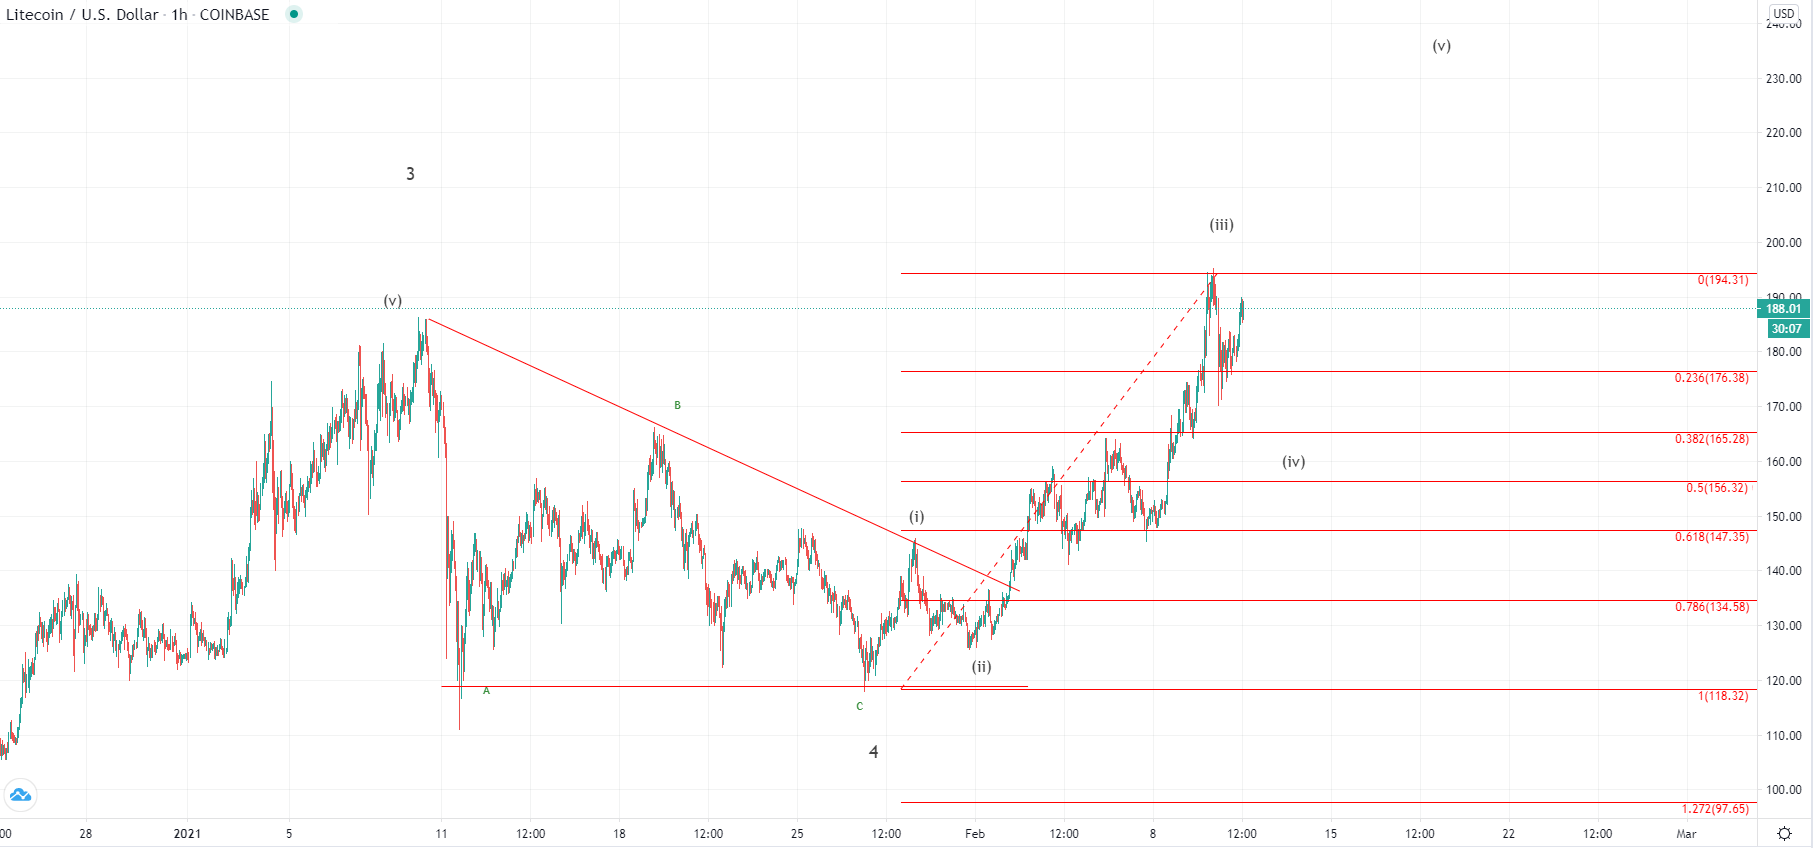
On the hourly chart, we can see that the price broke the prior high made on the 10th of January when the price of Litecoin was sitting at $185.58. This confirmed the impulsiveness behind the move and that the previous correction ended at $118. We have seen the development of the 3rd sub-wave of the higher degree impulse which is why further upside would be expected. However if yesterday’s high was the end of the 3rd wave, now the price might be set for a local correction.
Wave 4 should develop optimally to the 0.382 Fibonacci level which would bring the price of Litecoin to $165. But when the price tested prior resistance for support and confirms the bullish interest it is likely to continue moving past yesterday’s high and end around $230 before the completion of this five-wave move.
EOS/USD
Like in the case of Litecoin, the price of EOS has made a significant rise since last Thursday. On the 4th of February, the price was being traded just below $3 and from there it made an impulsive move to just below $5. This rise of around 50% pullback was made to the $3.5 zone but the price made ar recovery and is now in an upward trajectory, currently sitting at $4.2965.
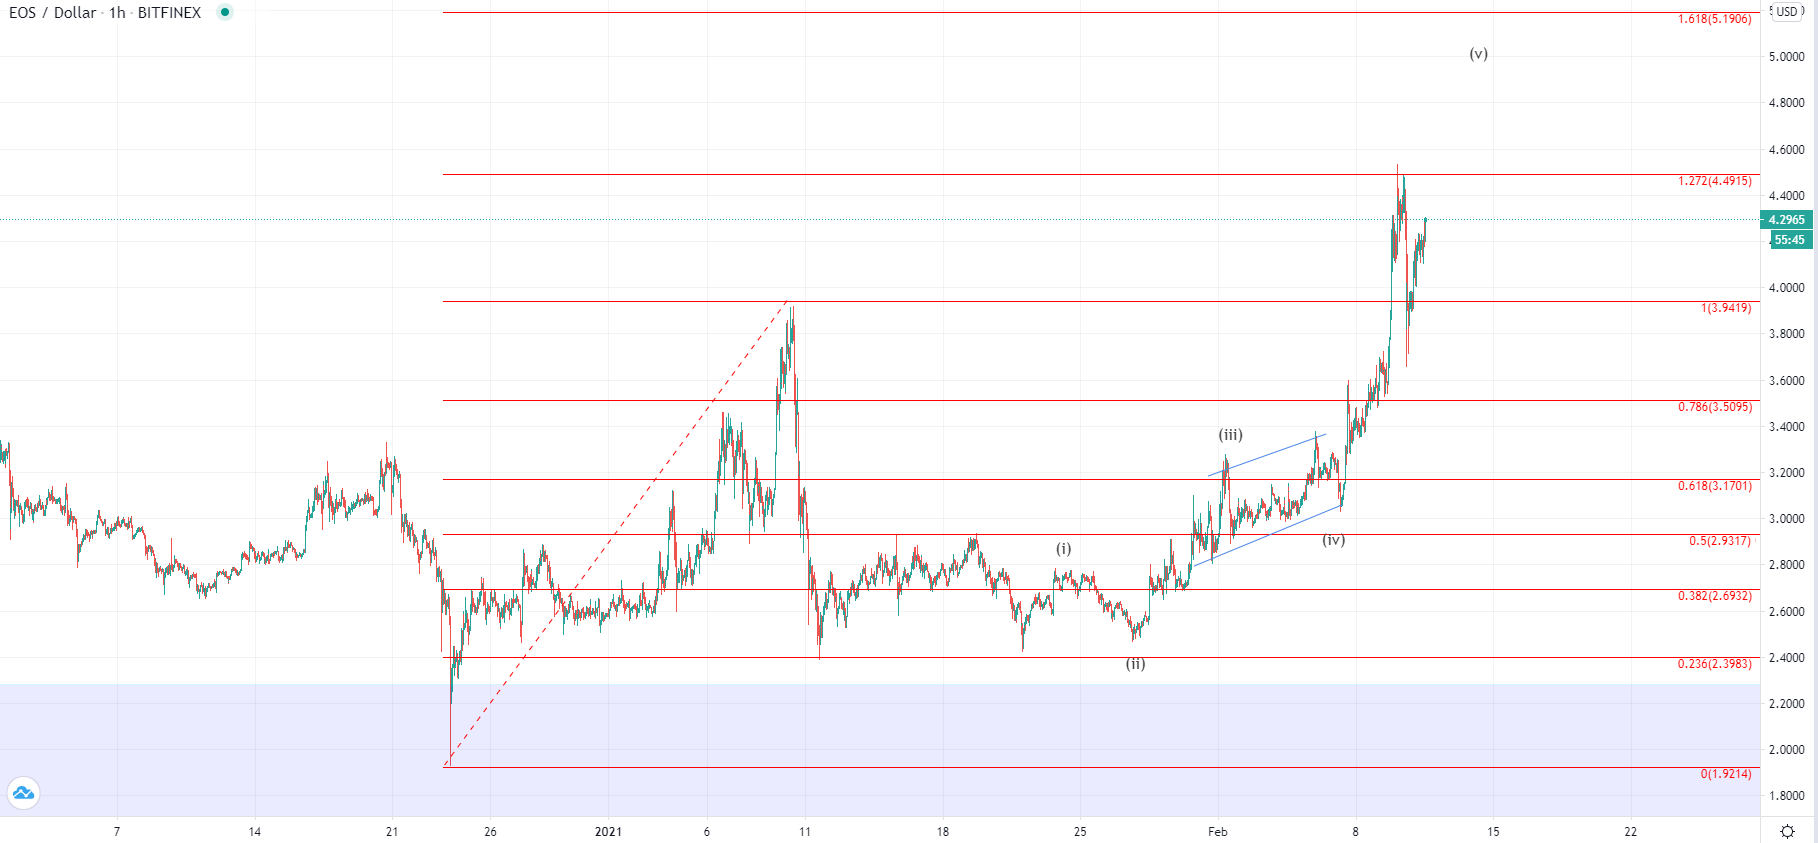
Looking at the hourly chart, you can see that the price made a parabolic rise which is why we have seen a corrective decrease of 17.6%. This could have indicated that the momentum has encountered the first significant seller’s zone above the prior high and is why now it is revisiting those levels for confirmation. Now we could expect to see some sideways movement if today’s recovery was continuo of the corrective drop.
Another possibility would be that today, we have seen the start of the next lower degree impulse which is set to exceed yesterday’s high. This would be validated if the price manages to go above the 1.272 Fib level on the current rise. If it however finds resistance there again, a double top could be form and the rejection could push the price back below $4 again. In either way further upside would be expected for the price of EOS.
This forecast represents FXOpen Markets Limited opinion only, it should not be construed as an offer, invitation or recommendation in respect to FXOpen Markets Limited products and services or as financial advice.
Cryptocurrency CFDs are not available to trade in all jurisdictions.
FXOpen offers the world's most popular cryptocurrency CFDs*, including Bitcoin and Ethereum. Floating spreads, 1:2 leverage — at your service (additional fees may apply). Open your trading account now or learn more about crypto CFD trading with FXOpen.
*Important: At FXOpen UK, Cryptocurrency trading via CFDs is only available to our Professional clients. They are not available for trading by Retail clients. To find out more information about how this may affect you, please get in touch with our team.
This article represents the opinion of the Companies operating under the FXOpen brand only. It is not to be construed as an offer, solicitation, or recommendation with respect to products and services provided by the Companies operating under the FXOpen brand, nor is it to be considered financial advice.
Stay ahead of the market!
Subscribe now to our mailing list and receive the latest market news and insights delivered directly to your inbox.


Latest articles

EUR/USD Eyes Gains As USD/CHF Weakness Deepens Again
EUR/USD started a fresh increase above 1.1700 and 1.1720. USD/CHF declined further and is now struggling below 0.7835.
Important Takeaways for EUR/USD and USD/CHF Analysis Today
· The Euro started a decent increase from

Apple: Earnings Day Above the Activity Zone
On 30 April, after the market close, Apple Inc. will release its financial results for the second quarter of fiscal 2026. The consensus forecast, based on estimates from 31 analysts, points to revenue of around $109.7 billion, with expected

USD/JPY and USD/CHF Near Key Levels: The Dollar Supported by the Fed
The US dollar continues to trend upwards following the Federal Reserve meeting, drawing support from the regulator’s moderately hawkish stance and comments by Jerome Powell. Markets interpret the Fed’s rhetoric as a signal that restrictive policy is likely