


LTC and EOS - Retesting the broken levels for resistance
FXOpen

LTC/USD
From Monday’s high when the price of Litecoin was sitting at around $74, we have seen a decrease of 26.67% measured to the lowest point the price has been yesterday which was at $54.25. Currently, the price is being traded at slightly above $57 as the price made a minor recovery from yesterday’s downfall but as you can see from the hourly chart the price is now retesting the broken horizontal level for resistance.
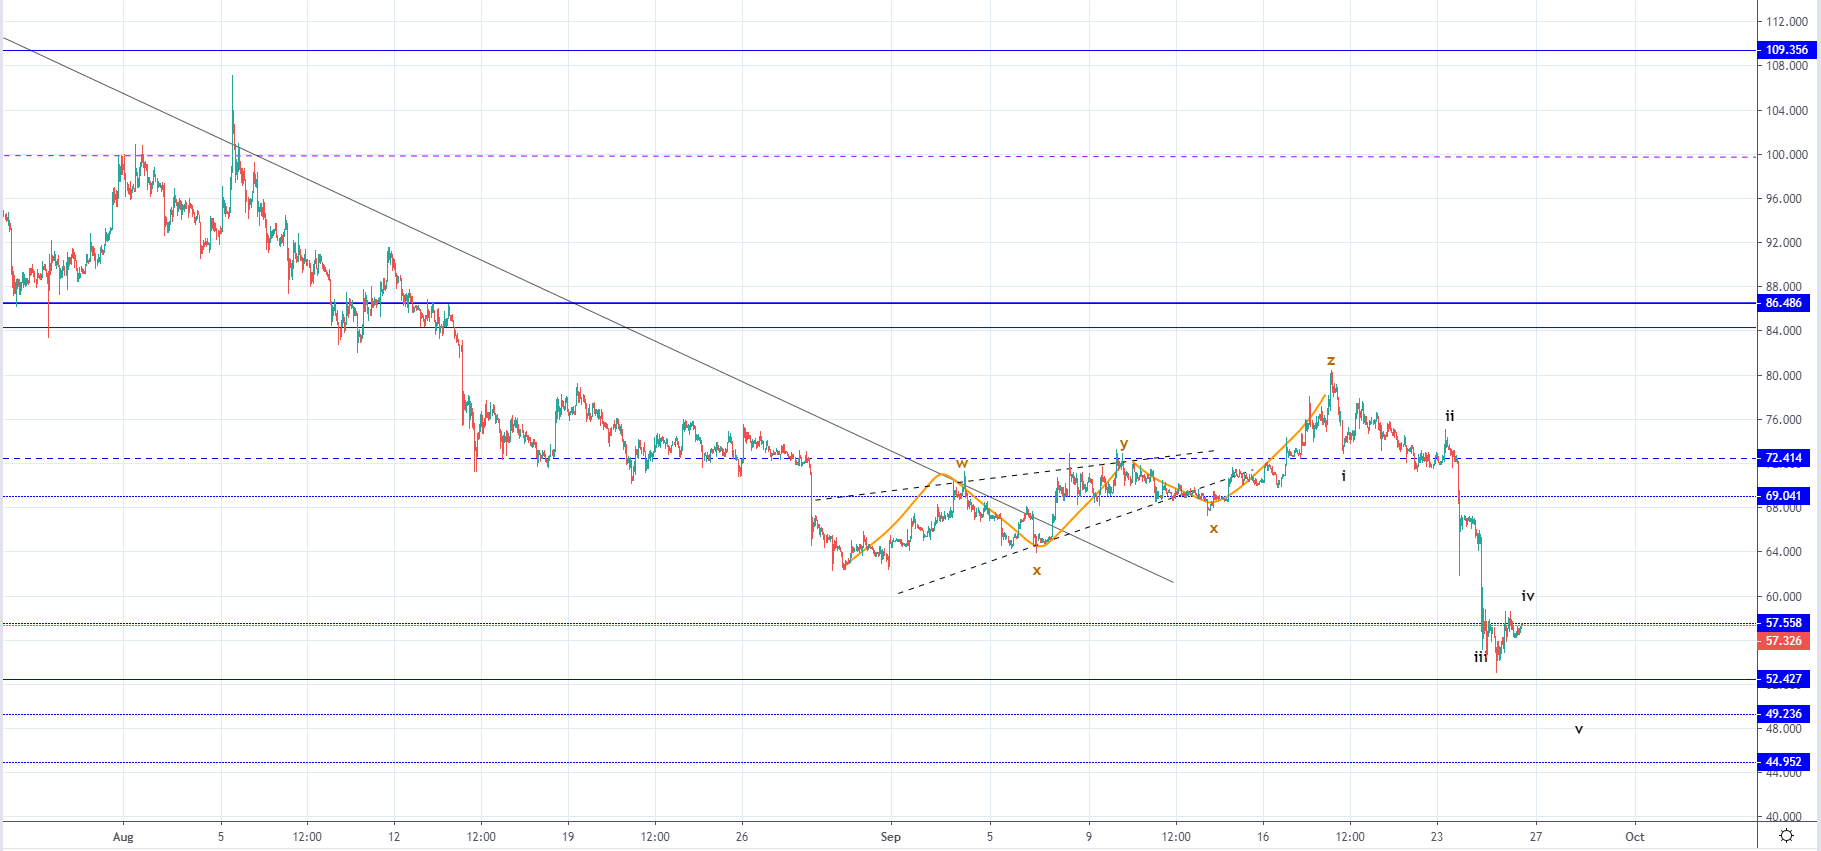
Prior to the impulsive downfall, we’ve seen a five-wave corrective move in an ascending triangle which pushed the price above the $72.4 significant level but as it was corrective another impulsive move to the downside started after its completion. As we are now likely seeing the development of the impulsive five-wave decrease the price is likely to continue moving to the downside for a bit more to some of the lower horizontal support levels.
As the price is currently retesting the $57.5 level for resistance we are to get a confirmation soon which would be in a form of rejection. The price is developing it’s 4th wave to the upside which is also corrective in nature which is why I would be expecting another downfall as the 5th wave should develop. If this is true, then the price is now likely to continue retesting the level or form a horizontal range between the $57.5 and the $52.4 horizontal levels but it might fall down to the $49.23 or $44.95 before the end of the decrease.
EOS/USD
The price of EOS has been sitting around $3.86 at its highest point on Monday from where we have seen a decrease of 37.84% measured to the lowest spike yesterday which was at $2.4. Now the price is being traded at $2.85 as we have seen a price recovery but like in the case of Litecoin the price is currently retesting its broken horizontal level from the downside, meaning the level is now serving as a resistance point.
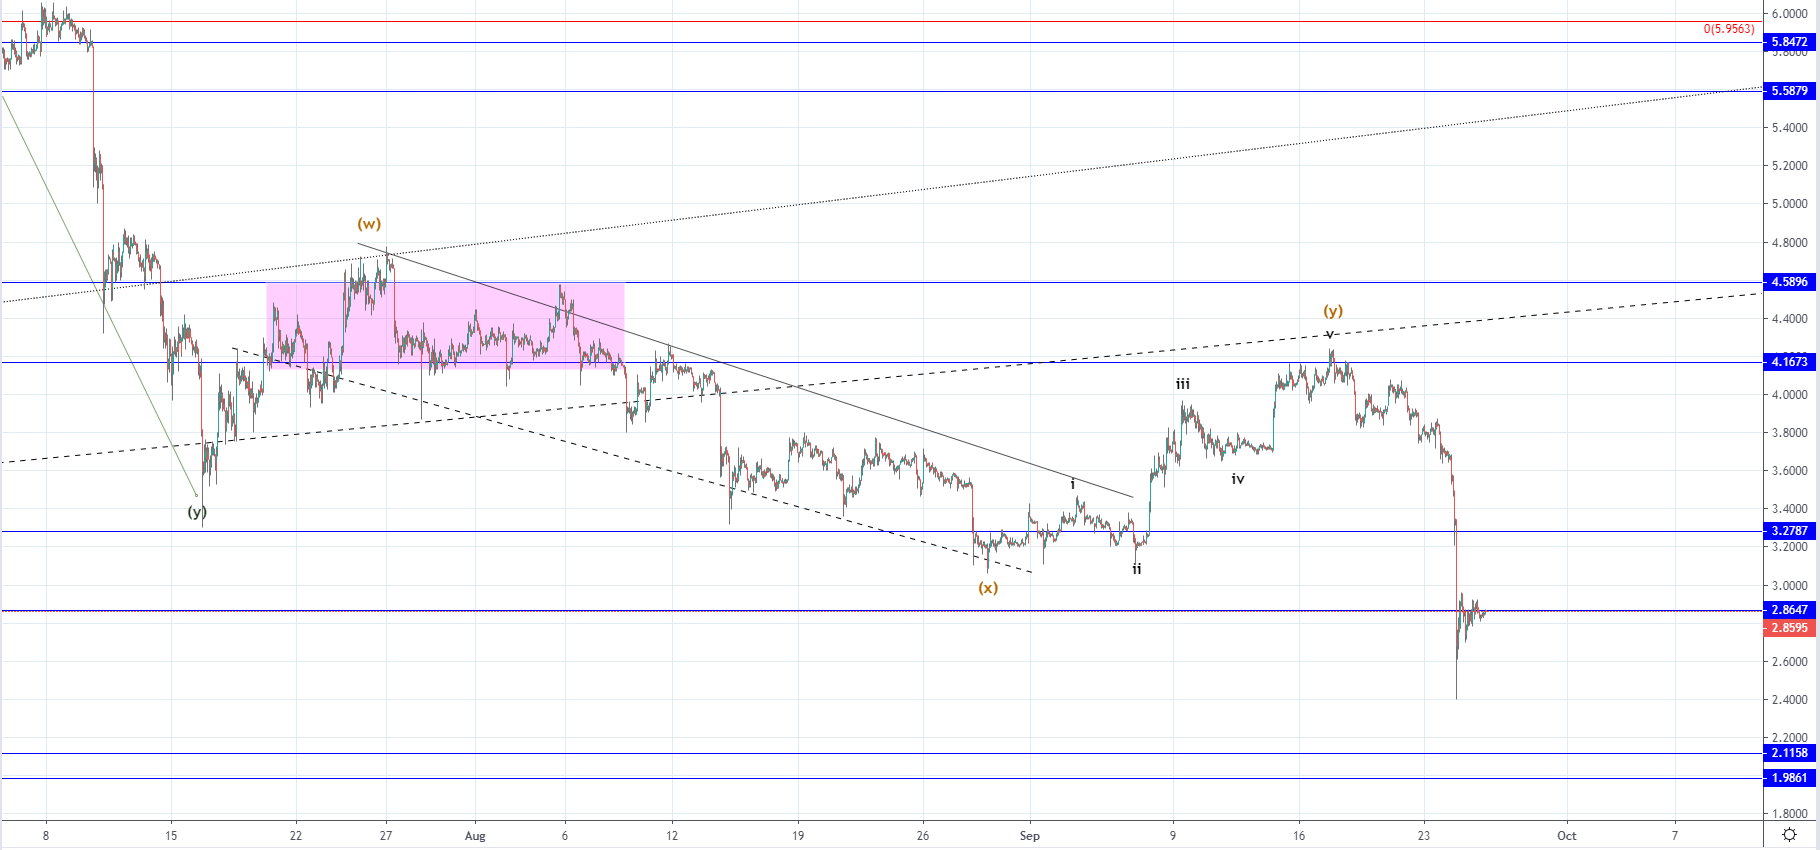 Looking at the hourly chart, we can see that prior to the downfall the price made a five-wave increase to the $4.16 horizontal level where it got rejected. The increase seen was most likely the Y wave from the WXY correction to the upside dating from the 16th of July. If this is true, then now we have seen the downtrend continuation as the correctional stage completed with the price now moving impulsively to the downside.
If the price finds resistance at the current levels another drop could be expected, or we can see the recovery continuing above the resistance point for a bit longer before another downfall to the lower levels at around $2.
FXOpen offers the world's most popular cryptocurrency CFDs*, including Bitcoin and Ethereum. Floating spreads, 1:2 leverage — at your service (additional fees may apply). Open your trading account now or learn more about crypto CFD trading with FXOpen.
*Important: At FXOpen UK, Cryptocurrency trading via CFDs is only available to our Professional clients. They are not available for trading by Retail clients. To find out more information about how this may affect you, please get in touch with our team.
This article represents the opinion of the Companies operating under the FXOpen brand only. It is not to be construed as an offer, solicitation, or recommendation with respect to products and services provided by the Companies operating under the FXOpen brand, nor is it to be considered financial advice.
Stay ahead of the market!
Subscribe now to our mailing list and receive the latest market news and insights delivered directly to your inbox.


Latest articles

EUR/USD Eyes Gains As USD/CHF Weakness Deepens Again
EUR/USD started a fresh increase above 1.1700 and 1.1720. USD/CHF declined further and is now struggling below 0.7835.
Important Takeaways for EUR/USD and USD/CHF Analysis Today
· The Euro started a decent increase from

Apple: Earnings Day Above the Activity Zone
On 30 April, after the market close, Apple Inc. will release its financial results for the second quarter of fiscal 2026. The consensus forecast, based on estimates from 31 analysts, points to revenue of around $109.7 billion, with expected

USD/JPY and USD/CHF Near Key Levels: The Dollar Supported by the Fed
The US dollar continues to trend upwards following the Federal Reserve meeting, drawing support from the regulator’s moderately hawkish stance and comments by Jerome Powell. Markets interpret the Fed’s rhetoric as a signal that restrictive policy is likely