


LTC and EOS - Showing Upside Potential
FXOpen
LTC/USD
From last week’s Thursday when the price of Litecoin was sitting at $45.58 at its lowest points, we have seen an increase of 13.38% measured to the highest point the price has been this week at $51.68. Since Monday’s high a pullback developed to the significant horizontal resistance level at $49.106 which was broken on the way up and the price is currently testing it for support.
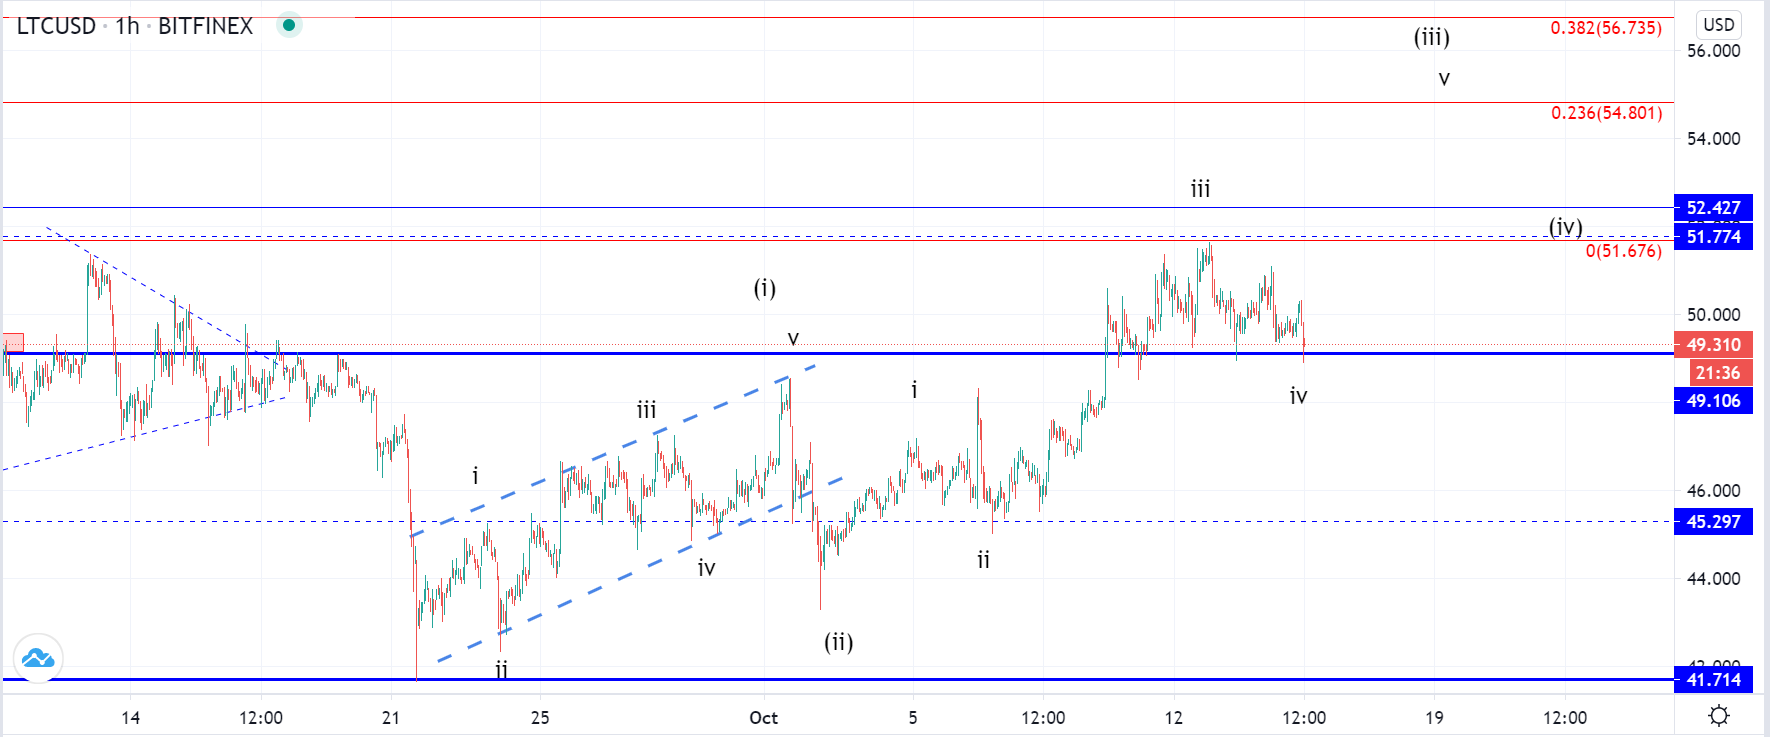
On the hourly chart, you can see that the price made an interaction today with the mentioned significant horizontal support and from the current candle it appears that the support is going to be present at those levels. More so this pullback should be a corrective one as the 4th wave out of the five-wave impulse to the upside would develop fully, further higher highs would be expected.
From the 21st of September, we have seen the formation of an ascending channel which was most likely the 1st wave out of the starting impulse and was a leading diagonal formation. If this is true, then the move to the downside that occurred in the first days of October was the 2nd wave which means that now we are seeing the development of the 3rd higher degree impulse.
As it hasn’t developed fully another higher high would be expected before its completion but that wouldn’t be the end of the expected increase as the price would manage to exceed the 0.5 Fib level and would have two more waves to develop.
EOS/USD
The price of EOS has been showing choppy price action since last week when it spiked to almost $3 on the 6th of October but fell back to the starting point of the increase at around $2.5 on the 8th. Since then another increase was seen to the $2.7 zone but from there a downtrend to $2.59 at its lowest yesterday.
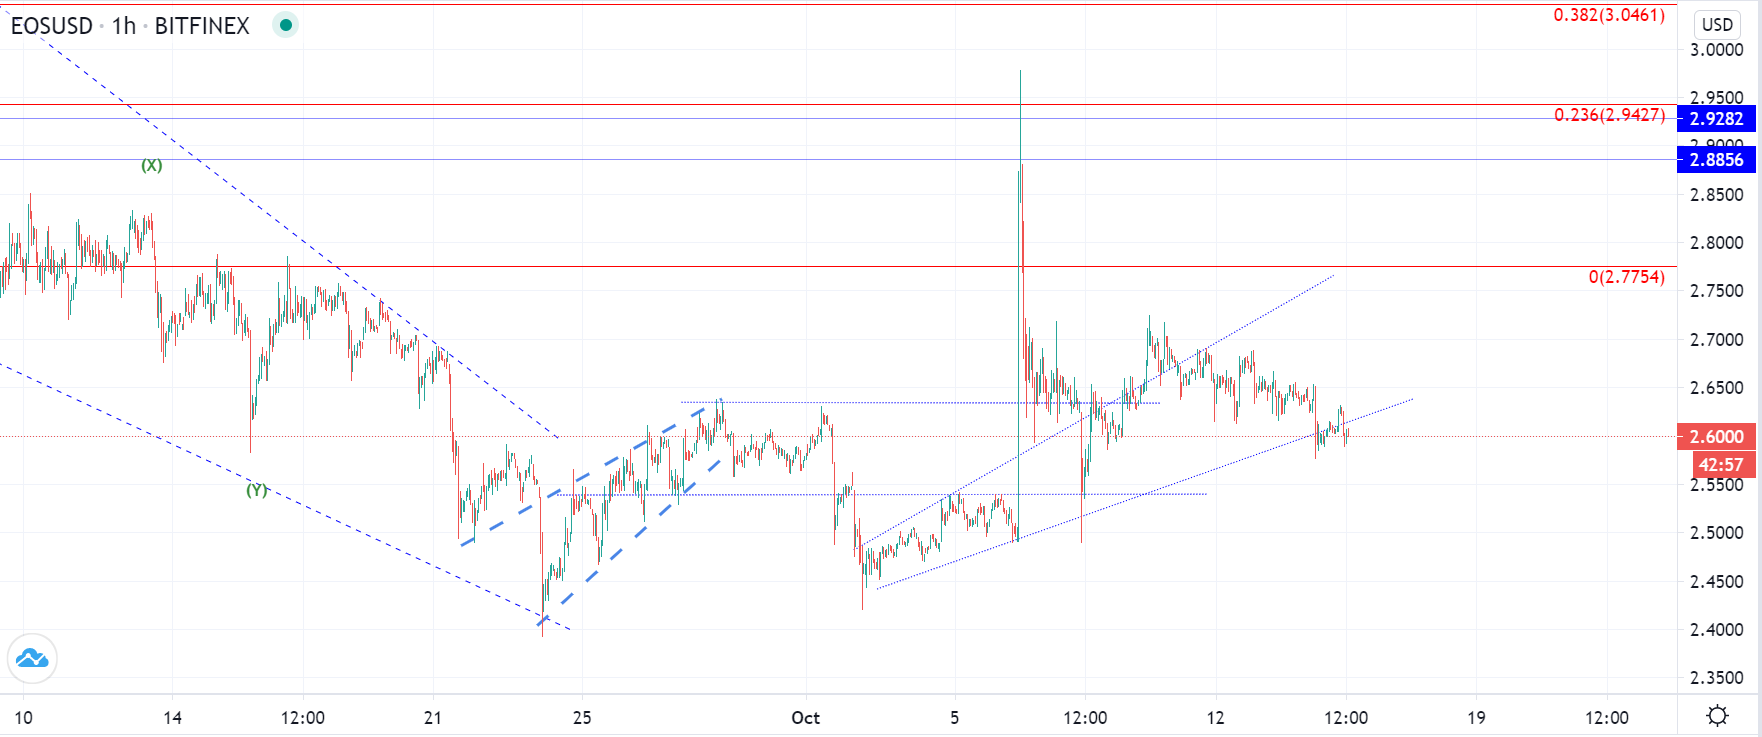
Currently, the price is being traded around those levels and has started to show early signs for bullishness as a minor high low was made today compared to yesterday’s one. Even though the price came below the horizontal level of the prior high, it found support on a slightly lower one which was the support zones’ lower level.
As the support looks present, further uptrend continuation would be expected, especially considering the market correlation and what’s been said about the price of Litecoin. We could be seeing a corrective increase but even so another higher high would be expected for its completion which in the case of EOS would likely be at around $3 where the price spiked on the 6th.
FXOpen offers the world's most popular cryptocurrency CFDs*, including Bitcoin and Ethereum. Floating spreads, 1:2 leverage — at your service (additional fees may apply). Open your trading account now or learn more about crypto CFD trading with FXOpen.
*Important: At FXOpen UK, Cryptocurrency trading via CFDs is only available to our Professional clients. They are not available for trading by Retail clients. To find out more information about how this may affect you, please get in touch with our team.
This article represents the opinion of the Companies operating under the FXOpen brand only. It is not to be construed as an offer, solicitation, or recommendation with respect to products and services provided by the Companies operating under the FXOpen brand, nor is it to be considered financial advice.
Stay ahead of the market!
Subscribe now to our mailing list and receive the latest market news and insights delivered directly to your inbox.


Latest articles

US Dollar Strengthens Amid Equity Market Weakness and Hawkish Fed Rhetoric
The US dollar continues to hold firm near multi-year highs as sentiment across equity markets deteriorates and investors increasingly expect the Federal Reserve to maintain a restrictive monetary policy stance for longer. The US economy remains resilient, while inflation risks

Bitcoin: Corrective Channel Broken as Traders Turn More Active
Bitcoin has come under the influence of several factors simultaneously. The wave of selling at the beginning of June was linked to Strategy's first disclosed Bitcoin sale in several years, a prolonged series of outflows from spot ETFs, and a

DAX 40: consolidation amid technology sell-off
A wave of selling in the technology sector that emerged earlier this week has weighed on European equities. The trigger was investor concern over the profitability of large-scale debt-funded investments by major US tech companies in AI infrastructure. The Nasdaq