


LTC and EOS - Sideways movement seen but another increase expected
FXOpen

LTC/USD
From Monday’s open at $35.4 the price of Litecoin has increased by 14.85% measured to its highest point this week at $40.7 made yesterday. Since yesterday’s high the price has started falling back and has made a minor retracement currently sitting at $39.56 and is moving sideways.
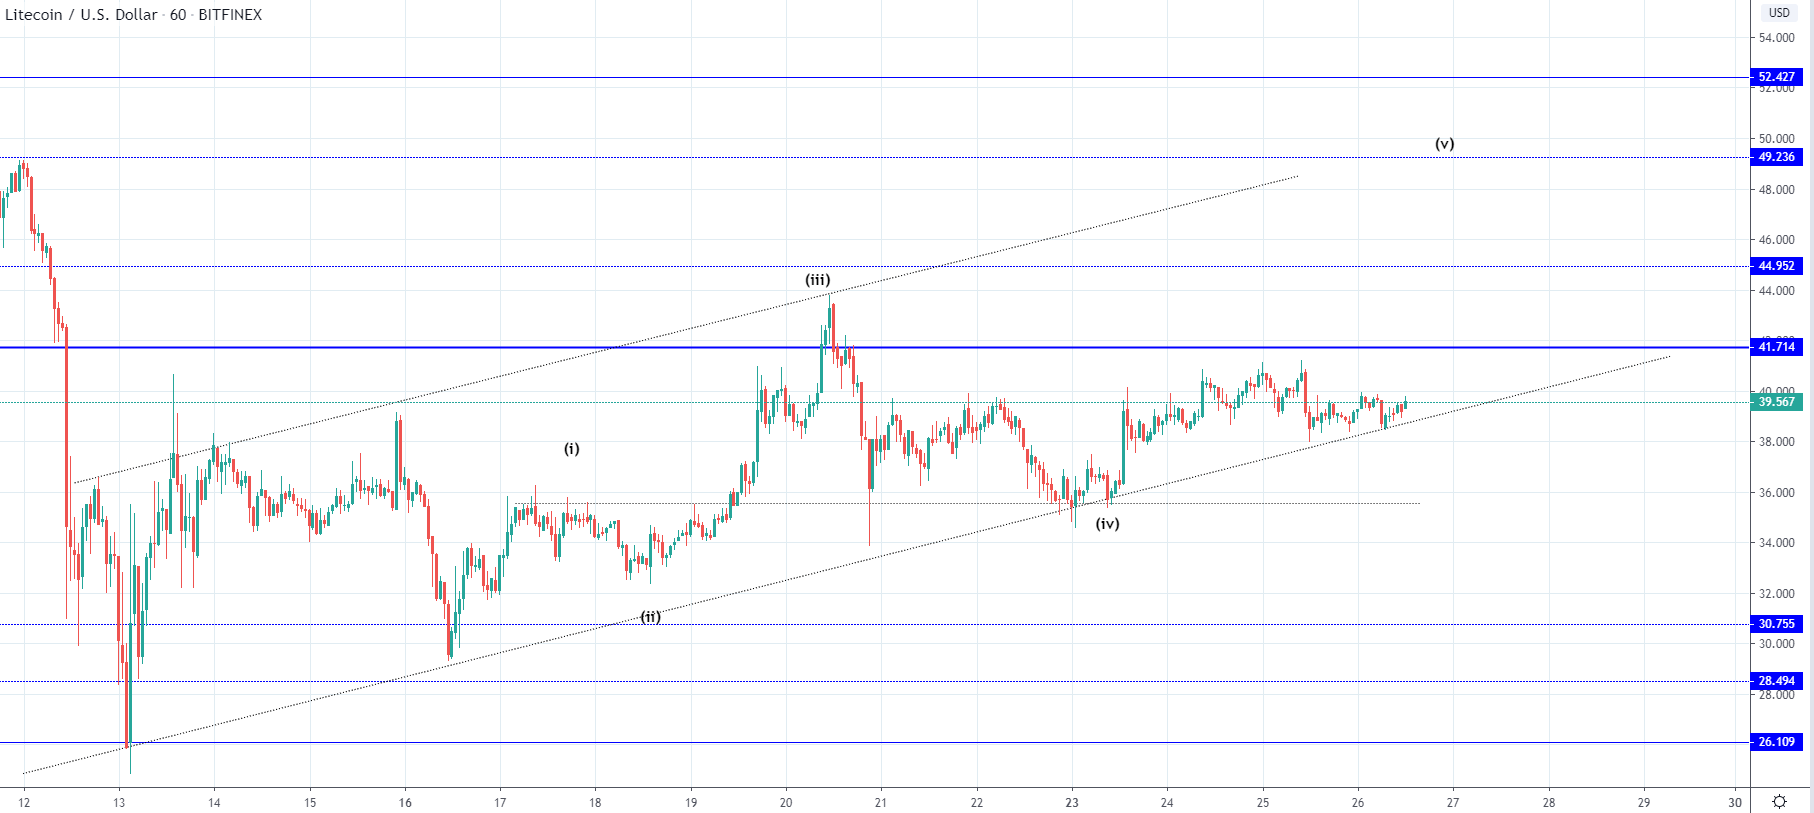
On the hourly chart, you can see that the price is currently testing the ascending support level from the 13th of March which has served as a baseline trendline and is the lower level from the ascending channel that has been formed. This ascending structure is most likely a corrective one which started to bring the price into recovery after a steep downfall to the $26.1 level.
As you can see the price has moved inside the boundaries of the ascending channel and considering that it’s currently sitting on its support level we can assume that now another increase could be expected. This is especially likely considering that the wave structure implies we are yet to see the 5th wave out of the five-wave impulse to the upside as the 4th wave tested the 1st wave’s ending point and managed to stay above it, validating the count.
The $41.7 horizontal resistance is a significant level that served as strong support and is now serving as a strong resistance which was confirmed but an interaction made last Friday on the 20th when it’s retest ended as a hard rejection that pushed the price into 15.19% decrease. That’s why the 5th wave could end as a truncation barely coming to the vicinity of the prior high but in theory we can see interaction with the upper horizontal resistance level at around $49 which could correlate with the ascending channel’s resistance level being retested again before the completion of this five-wave pattern.
EOS/USD
The price of EOS has been moving in a similar manner like the price of Litecoin in the last couple of days as after an interaction with its significant horizontal level has been seen with whom an interaction has lead into a sideways movement. 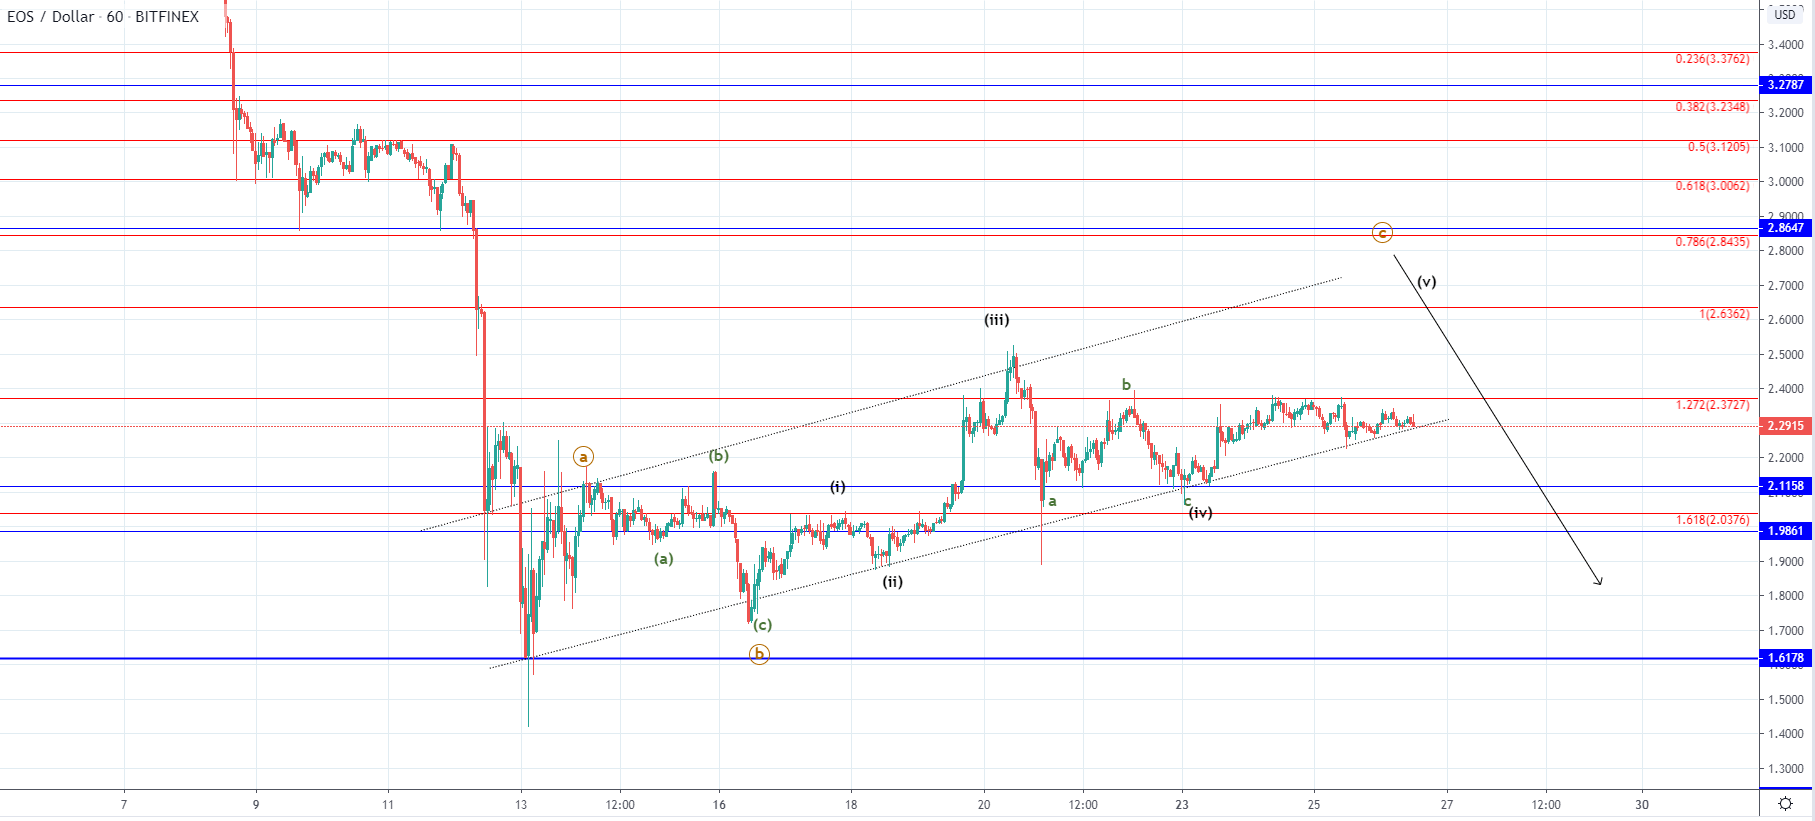 On Monday’s open the price was sitting at $2.11 from where we have seen an increase of 12.23% measured to the 1.272 Fib level at $2.372 but the price is currently sitting at $2.3 and is retesting the ascending support trendline. Looking at the hourly chart, we can see that the price has been hovering below the mentioned Fib level but this could change is the price finds support on the current interaction as another 5th wave to the upside could be seen.
FXOpen offers the world's most popular cryptocurrency CFDs*, including Bitcoin and Ethereum. Floating spreads, 1:2 leverage — at your service (additional fees may apply). Open your trading account now or learn more about crypto CFD trading with FXOpen.
*Important: At FXOpen UK, Cryptocurrency trading via CFDs is only available to our Professional clients. They are not available for trading by Retail clients. To find out more information about how this may affect you, please get in touch with our team.
This article represents the opinion of the Companies operating under the FXOpen brand only. It is not to be construed as an offer, solicitation, or recommendation with respect to products and services provided by the Companies operating under the FXOpen brand, nor is it to be considered financial advice.
Stay ahead of the market!
Subscribe now to our mailing list and receive the latest market news and insights delivered directly to your inbox.


Latest articles

EUR/USD Eyes Gains As USD/CHF Weakness Deepens Again
EUR/USD started a fresh increase above 1.1700 and 1.1720. USD/CHF declined further and is now struggling below 0.7835.
Important Takeaways for EUR/USD and USD/CHF Analysis Today
· The Euro started a decent increase from

Apple: Earnings Day Above the Activity Zone
On 30 April, after the market close, Apple Inc. will release its financial results for the second quarter of fiscal 2026. The consensus forecast, based on estimates from 31 analysts, points to revenue of around $109.7 billion, with expected

USD/JPY and USD/CHF Near Key Levels: The Dollar Supported by the Fed
The US dollar continues to trend upwards following the Federal Reserve meeting, drawing support from the regulator’s moderately hawkish stance and comments by Jerome Powell. Markets interpret the Fed’s rhetoric as a signal that restrictive policy is likely