


LTC and EOS - Starting impulse or a C wave?
FXOpen

LTC/USD
From last Wednesday when the price of Litecoin fell to $36.79 at its lowest point, measured to Monday’s high at $42.56 we have seen an increase of 15.68%. Since Monday’s high the price has been in a downward trajectory and is currently being traded around its lowest of the week which is at around $40.
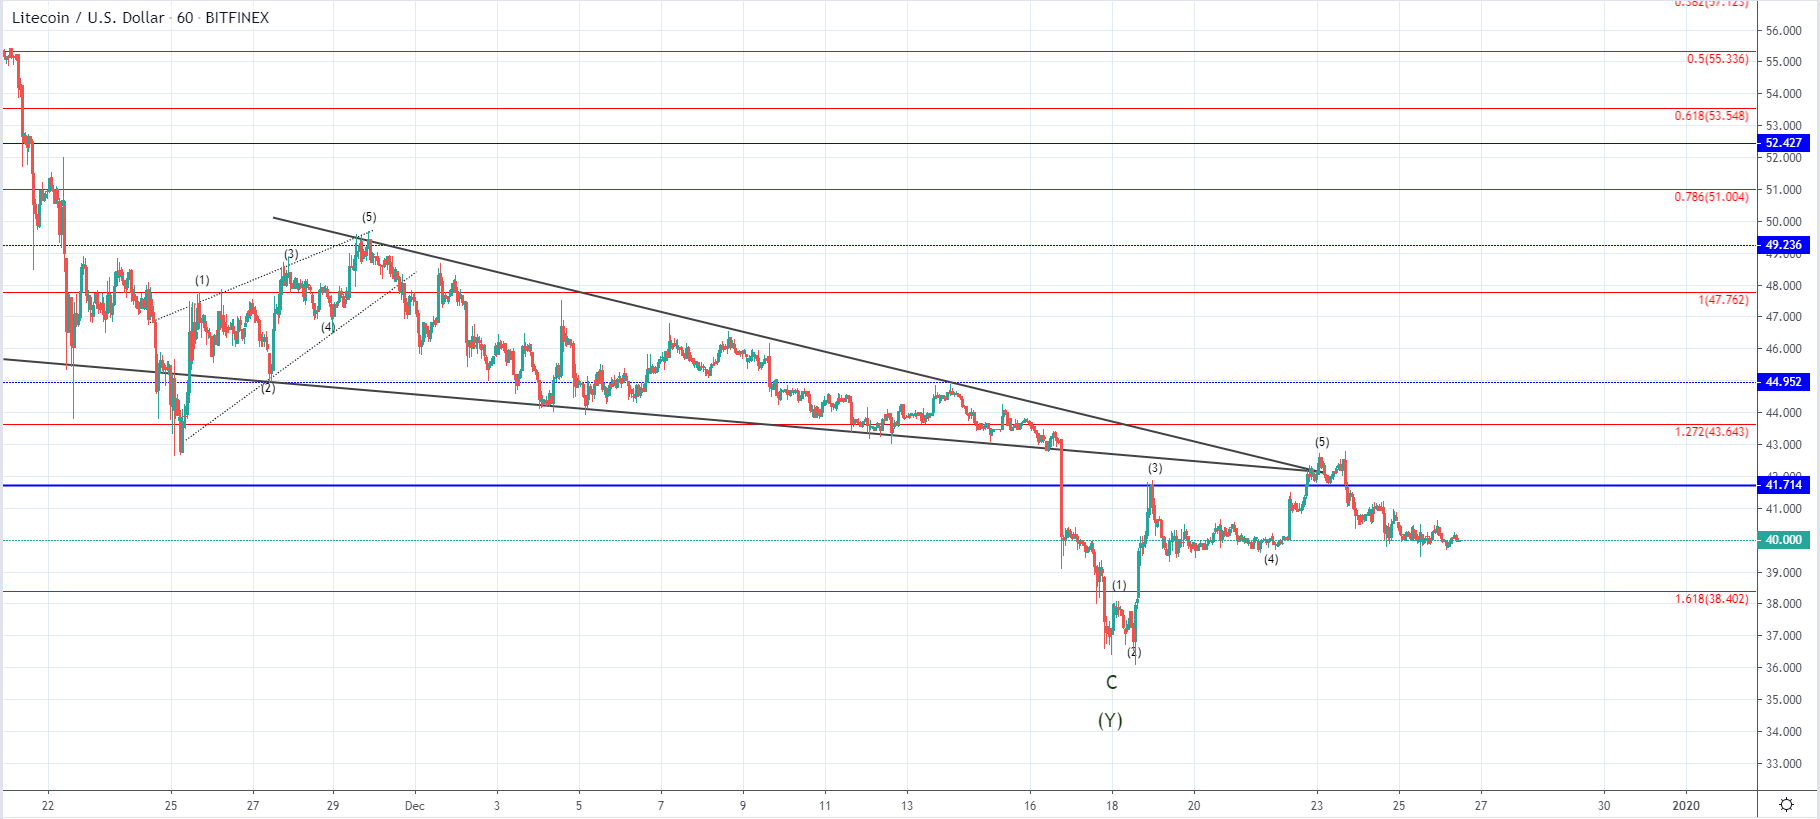 Looking at the hourly chart, you can see that the price broke down from the descending triangle last week with strong bearish momentum indicating impulsiveness. The price fell below 1.618 Fibonacci level but as it entered the buyer’s territory, buying was activated and we have seen a recovery close to the vicinity of the resistance level from the descending triangle. This could be interpreted as a retest of its support for resistance especially considering that the price came only for a short while above $41.7 horizontal level. Resistance was found as seen on the chart, which is why another downside move has been seen.
This could be a minor retracement before the next wave to the upside starts, considering that we have seen a five-wave increase. But considering that the price broke out from the descending triangle and formed another five-wave move to the upside we could have seen the C wave out of the ABC to the upside with the prior ascending triangle being its A wave.
From the depth of the current retracement and the momentum of the next move to the upside, we are going to evaluate these possibilities.
EOS/USD
Like in the case of Litecoin, the price of EOS has recovered significantly from last Wednesday when it was sitting at $2.19 at its lowest point, coming to $2.6 at its highest on Monday this week which was an increase of 18.6%. Currently, the price is being traded at around $2.49 as it was in a downward trajectory since the start of the week.
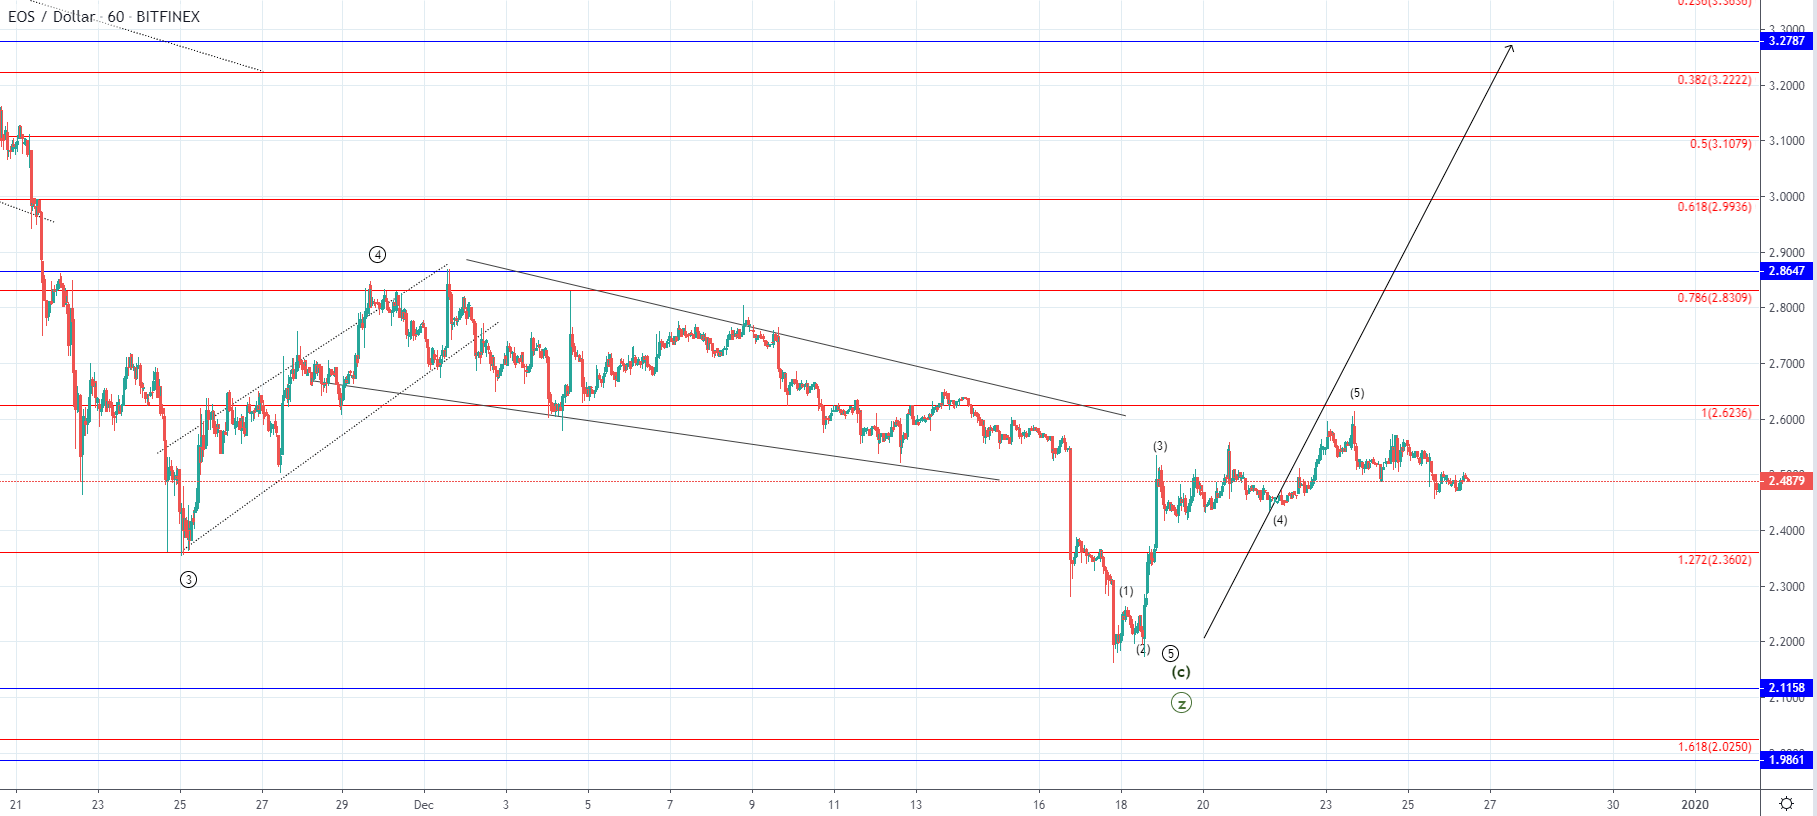
As you can see by looking at the hourly chart, I was expecting this spike to the upside but as the beginning of the larger recovery. A five-wave move to the upside developed which could be the 1st sub-wave of the higher degree impulse wave. If this is true then the decline seen from Monday is its 2nd wave developing which can push the price all the way back to the prior low although unlikely.
More likely we are to see a retest of the prior higher low at 1.272 Fib level before further uptrend continuation if this is a starting impulse. If the price, however, goes below the 1.272 Fibonacci level it will indicate that the spike seen from last Wednesday till Monday this week could have been the C wave out of the ABC to the upside with further lows ahead.
FXOpen offers the world's most popular cryptocurrency CFDs*, including Bitcoin and Ethereum. Floating spreads, 1:2 leverage — at your service (additional fees may apply). Open your trading account now or learn more about crypto CFD trading with FXOpen.
*Important: At FXOpen UK, Cryptocurrency trading via CFDs is only available to our Professional clients. They are not available for trading by Retail clients. To find out more information about how this may affect you, please get in touch with our team.
This article represents the opinion of the Companies operating under the FXOpen brand only. It is not to be construed as an offer, solicitation, or recommendation with respect to products and services provided by the Companies operating under the FXOpen brand, nor is it to be considered financial advice.
Stay ahead of the market!
Subscribe now to our mailing list and receive the latest market news and insights delivered directly to your inbox.


Latest articles

EUR/USD Eyes Gains As USD/CHF Weakness Deepens Again
EUR/USD started a fresh increase above 1.1700 and 1.1720. USD/CHF declined further and is now struggling below 0.7835.
Important Takeaways for EUR/USD and USD/CHF Analysis Today
· The Euro started a decent increase from

Apple: Earnings Day Above the Activity Zone
On 30 April, after the market close, Apple Inc. will release its financial results for the second quarter of fiscal 2026. The consensus forecast, based on estimates from 31 analysts, points to revenue of around $109.7 billion, with expected

USD/JPY and USD/CHF Near Key Levels: The Dollar Supported by the Fed
The US dollar continues to trend upwards following the Federal Reserve meeting, drawing support from the regulator’s moderately hawkish stance and comments by Jerome Powell. Markets interpret the Fed’s rhetoric as a signal that restrictive policy is likely