


LTC and EOS - Symmetrical triangle's formed with a breakout soon expected
FXOpen

LTC/USD
From last Thursday when the price of Litecoin was sitting at $48 level we have seen a decrease of 6.43% at first to $44.91 but it started moving to the upside since and continued developing it’s price action in a sideways manner. Currently, the price is being traded at $46.28 and is starting to move to the downside.
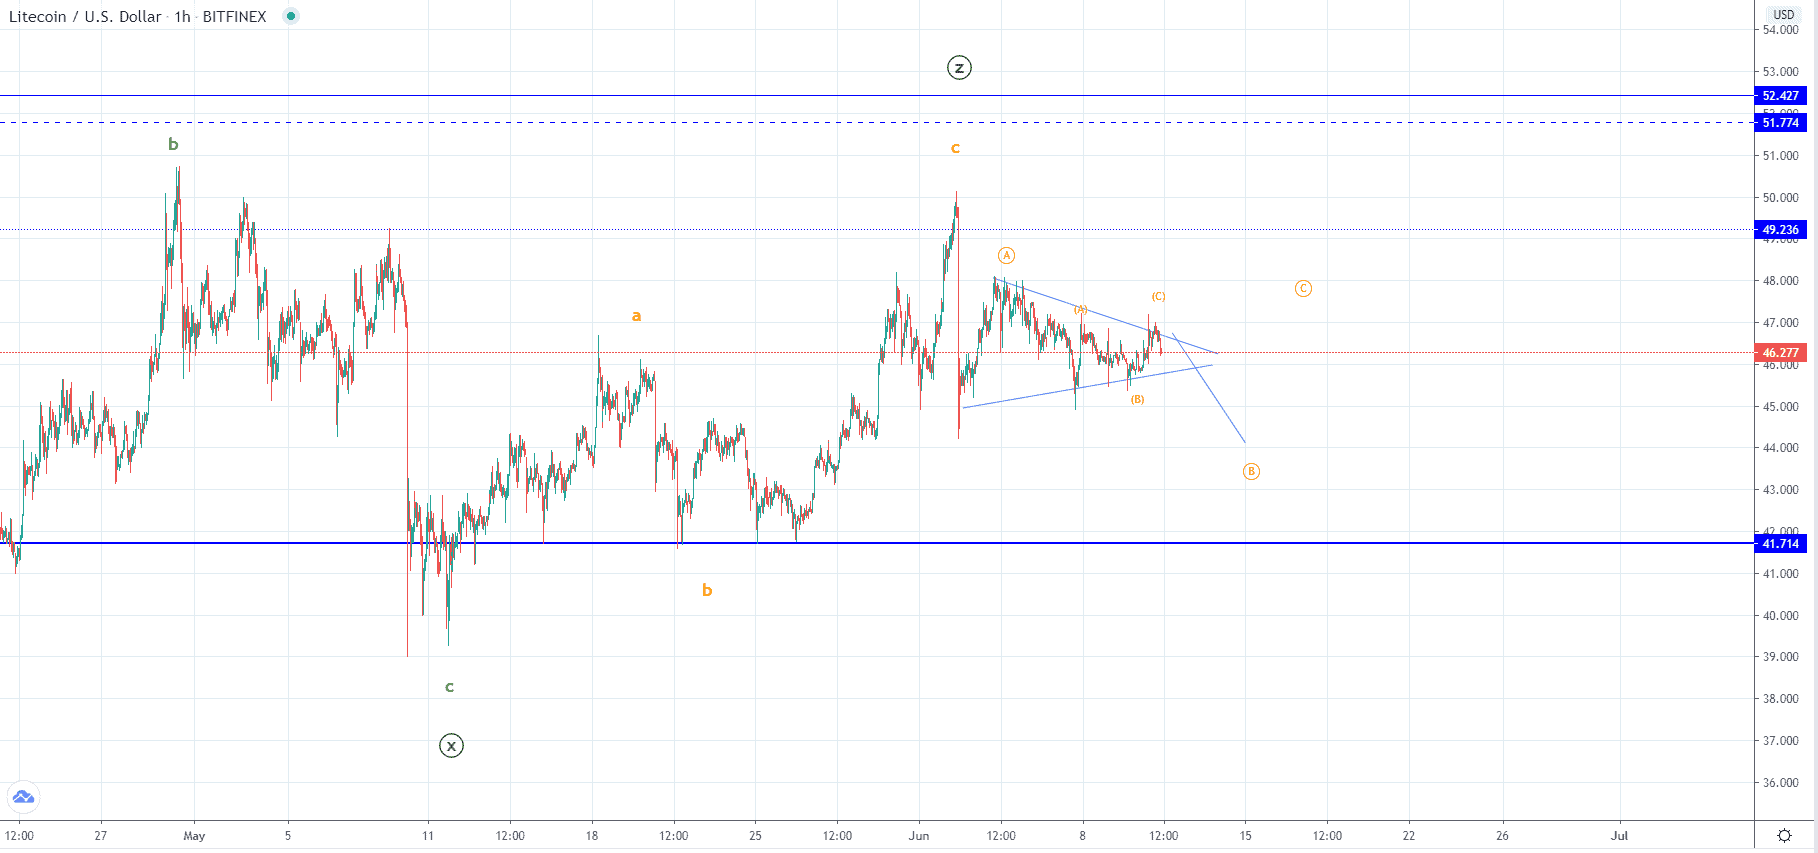 On the hourly chart, you can see that from last Thursday we have seen the formation of the symmetrical triangle when the price was established its outline levels. Today as the resistance level has been tested and the price found resistance there yet again we could be seeing the start of the breakout momentum to the downside. The wave structure implies that we have seen an ABC correction to the upside of a Submicro degree as the second sub-wave of the higher degree ABC count so we could be seeing further sideways movement on the higher time frame as the projected decrease is to be the B wave of the mentioned higher degrees ABC.
The expected decrease would be set to retest the vicinity of the $44 horizontal level after which I would be expecting another upside move to the mid-range of the symmetrical triangle at around $47 area. But as the Minute count Z wave likely ended on an even higher scale after the completion of this sideways movement I would be looking for the start of the sustainable downtrend.
EOS/USD
The price of EOS has been also forming a triangle as from last Friday we have seen the establishment of its upper resistance level when the price came up to $2.86 level for a retest where it found resistance and started decreasing to $2.689 at its lowest. It is currently being traded slightly above the weekly low but managing to maintain above the horizontal support at $2.7.
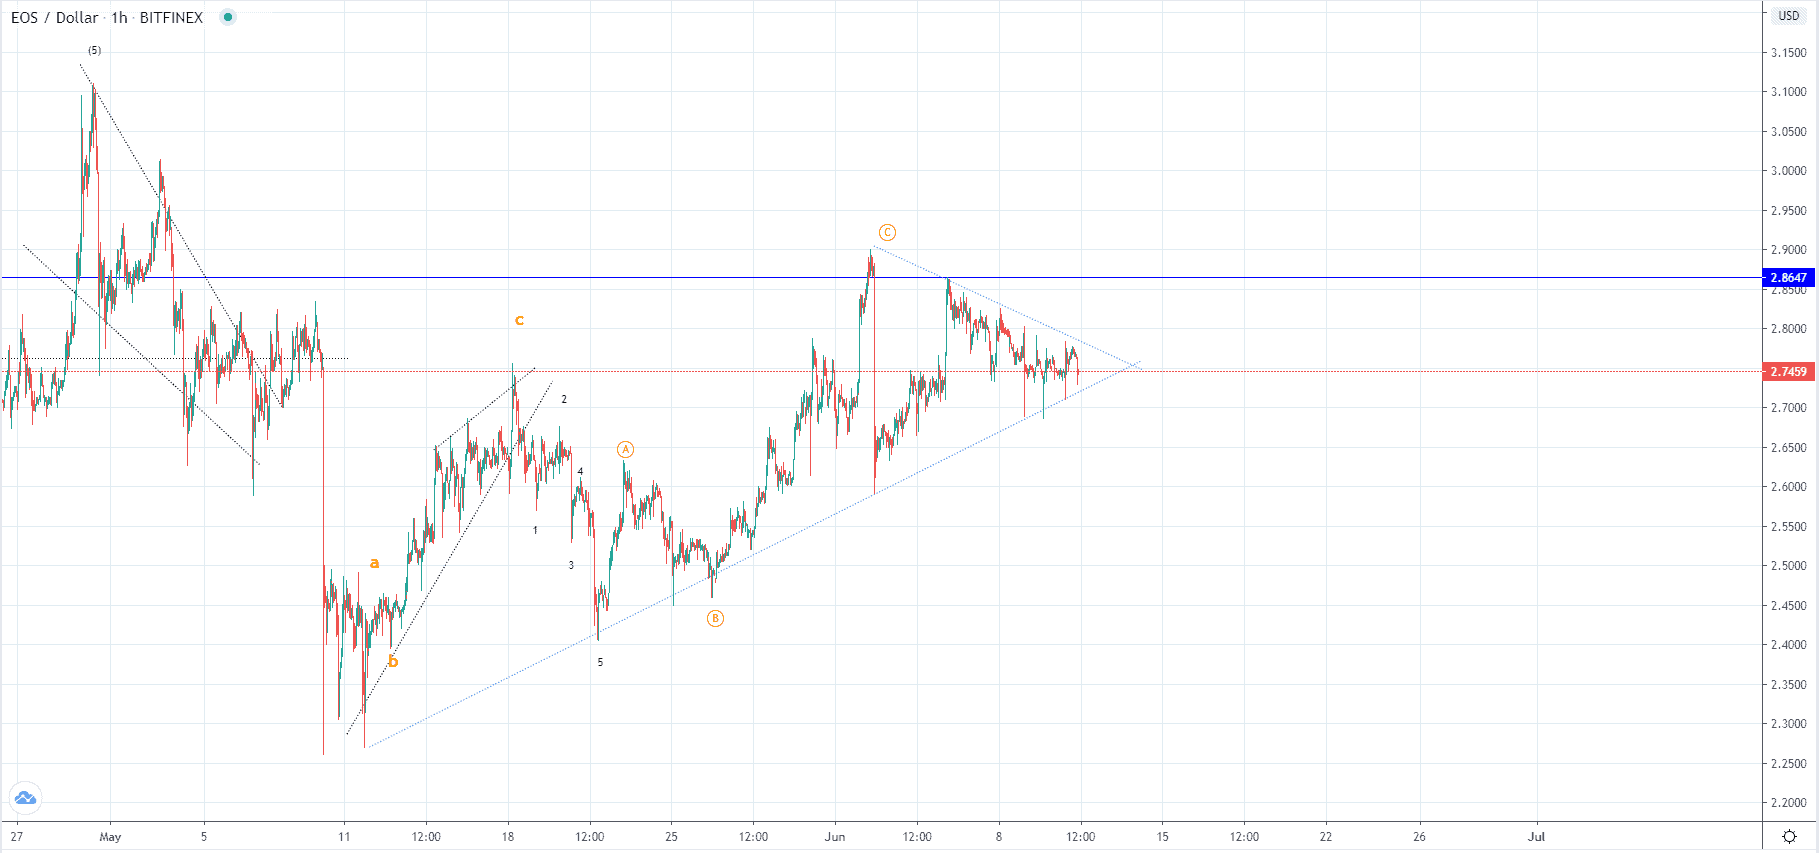 Looking at the hourly chart we can see that the price retested the ascending support trendline from the 11th of May and found support there which is why like in the case of Litecoin a symmetrical triangle has been formed. As a breakout is getting closer to start it’s direction is still unclear but if we have seen the completion of the upward ABC it is likely headed to the downside, especially considering the spiky downward impulse we have seen on the 2nd of June when the price decrease from $2.89 to $2.59 which was a decrease of 10.57%.
FXOpen offers the world's most popular cryptocurrency CFDs*, including Bitcoin and Ethereum. Floating spreads, 1:2 leverage — at your service (additional fees may apply). Open your trading account now or learn more about crypto CFD trading with FXOpen.
*Important: At FXOpen UK, Cryptocurrency trading via CFDs is only available to our Professional clients. They are not available for trading by Retail clients. To find out more information about how this may affect you, please get in touch with our team.
This article represents the opinion of the Companies operating under the FXOpen brand only. It is not to be construed as an offer, solicitation, or recommendation with respect to products and services provided by the Companies operating under the FXOpen brand, nor is it to be considered financial advice.
Stay ahead of the market!
Subscribe now to our mailing list and receive the latest market news and insights delivered directly to your inbox.


Latest articles

DAX 40: consolidation amid technology sell-off
A wave of selling in the technology sector that emerged earlier this week has weighed on European equities. The trigger was investor concern over the profitability of large-scale debt-funded investments by major US tech companies in AI infrastructure. The Nasdaq

Euro Hits Fresh Yearly Lows Amid Dovish ECB Signals
The euro remains under pressure following weak macroeconomic data from the euro area and fresh signals that the European Central Bank is prepared to maintain a more accommodative monetary policy stance. Data released yesterday pointed to a deterioration in business

Pound at Key Levels: Markets Assess Impact of Political Uncertainty in the UK
The British pound remains under pressure following increased political uncertainty in the United Kingdom triggered by the Prime Minister’s resignation. Investors are assessing potential shifts in the political and economic policy outlook after the head of government stepped down,