


LTCUSD Technical Analysis – 06th APR, 2023
FXOpen
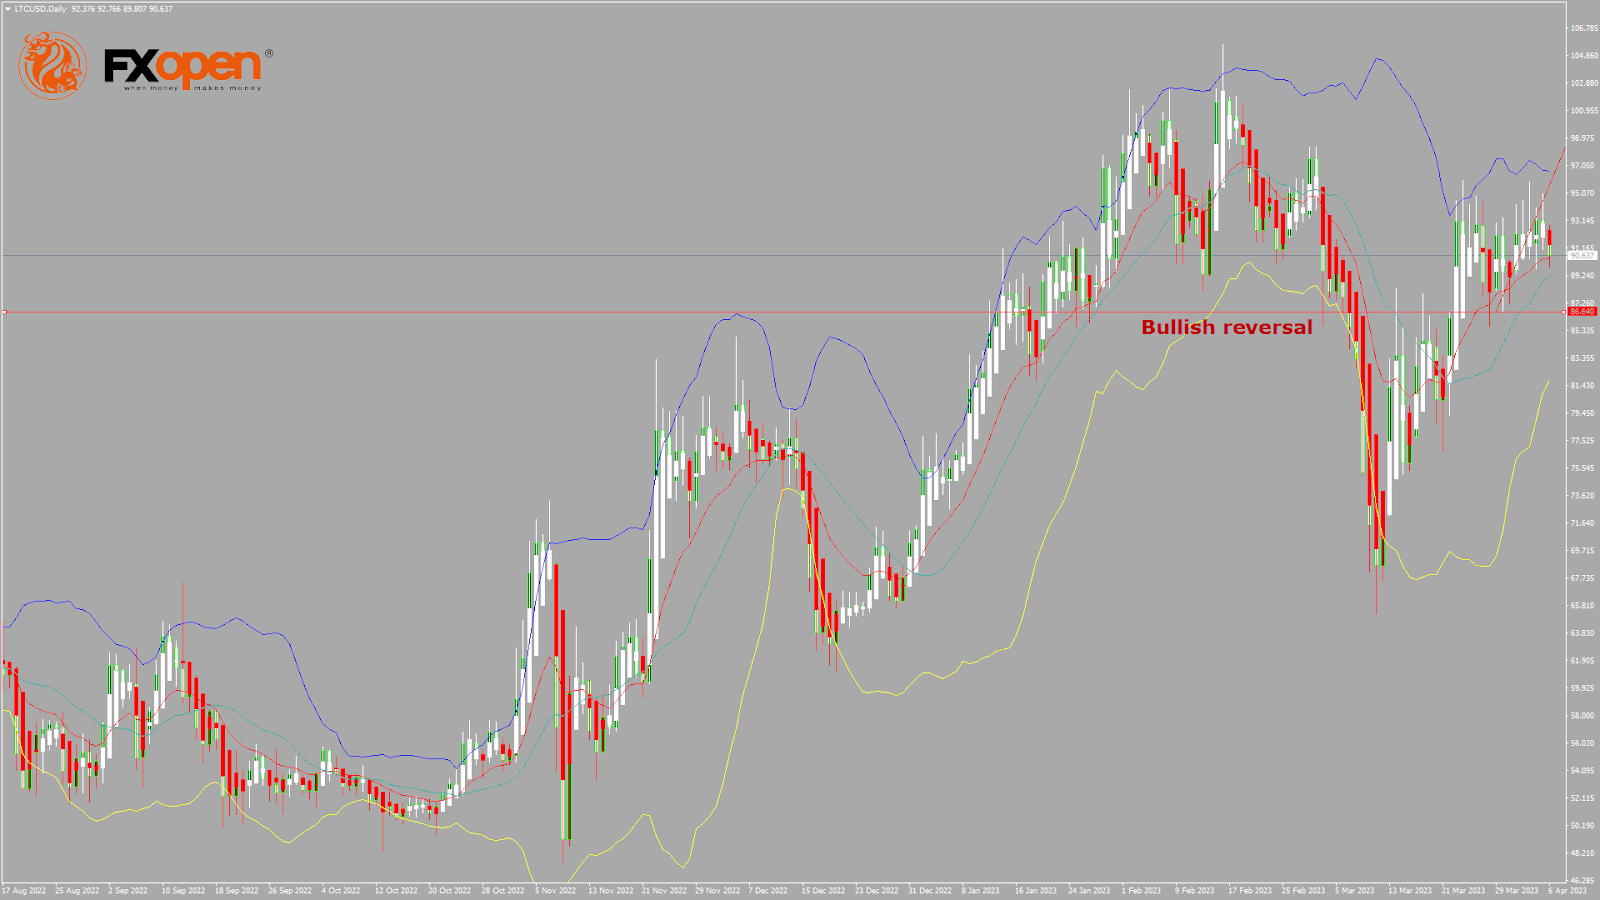
LTCUSD – Bullish Harami Pattern Is Above $86.64

Bears couldn't pull the market further down last week, and after touching a low of $86.64 on 30th March, the prices started to correct upwards against the US Dollar, touching a high of $94.91 on 03rd April.
We have seen a bullish opening of the markets this week.
We can see a bullish harami pattern above the $86.64 handle. It signifies the end of a bearish phase and the start of a bullish phase in the market.
The price of Litecoin is near the channel's support, indicating upcoming bullish movement. Also, Litecoin is trading above its 100-hour simple moving average and 100-hour exponential moving average, and it's above the pivot level of $92.93.
The relative strength index is at $52.50, indicating a neutral demand for Litecoin and a shift towards the market consolidation phase.
The prices of Litecoin continue to remain above some of the moving averages, which are giving a bullish signal at current market levels of $90.65
Both the Williams percent range and commodity channel index are signalling neutral market conditions, which means that the price is expected to remain in a consolidation phase in the short-term range.
The short-term outlook for Litecoin has turned mildly bullish.
- Some of the technical indicators are giving a bullish signal.
- Litecoin bullish reversal is seen above the $86.64 level.
- The RSI gives a neutral signal.
- The average true range indicates low market volatility.
Litecoin Bullish Reversal Seen Above $86.64
The price of Litecoin continues to move in a mild bullish momentum above the $90 handle, but it entered a consolidation zone in the European trading session.
We can see the formation of a bullish crossover of 20-day and 50-day moving averages.
The price of LTCUSD is now facing its classic resistance levels of 94.68 and Fibonacci resistance levels of 96.69, after which the path towards $100 will get cleared.
Litecoin faces resistance at the $92.88 pivot point and $93.92.
Litecoin trading volume has increased by 0.01% compared to yesterday, which appears normal.
The Week Ahead
The price of Litecoin has been facing stiff resistance at $97 in the last 30 days. It’s moving into a consolidation phase, after which we can see fresh upsides towards $95 and $100.
Some of the technical indicators are signalling a neutral sentiment in the market.
Litecoin should stay above the important support level of $88.44, which is a 14 Day RSI at 50, and at $90.13, which is a 38.2% retracement from a 13-week high.
The short-term outlook for Litecoin has turned mildly bullish, the medium-term outlook is bullish, and the long-term outlook is neutral at present market conditions.
The weekly projection is $100, with a consolidation zone of $95.
FXOpen offers the world's most popular cryptocurrency CFDs*, including Bitcoin and Ethereum. Floating spreads, 1:2 leverage — at your service (additional fees may apply). Open your trading account now or learn more about crypto CFD trading with FXOpen.
*Important: At FXOpen UK, Cryptocurrency trading via CFDs is only available to our Professional clients. They are not available for trading by Retail clients. To find out more information about how this may affect you, please get in touch with our team.
This article represents the opinion of the Companies operating under the FXOpen brand only. It is not to be construed as an offer, solicitation, or recommendation with respect to products and services provided by the Companies operating under the FXOpen brand, nor is it to be considered financial advice.
Stay ahead of the market!
Subscribe now to our mailing list and receive the latest market news and insights delivered directly to your inbox.


Latest articles

NZD/USD Analysis: A Tug-of-War at the Critical Level
The kiwi has strengthened meaningfully against most peers this month. However, against the US dollar specifically, NZD/USD remains well below its 2026 highs, trading in the mid-0.58 area versus January's peak near 0.6075.
New Zealand's Q2 inflation

AUD/USD and USD/CAD React to Rising Geopolitical Risks
Commodity-linked currencies remain under pressure as geopolitical tensions in the Middle East continue to escalate. The United States has maintained strikes on targets in Iran, while the Tehran-backed Houthis have intensified threats to shipping in the Red Sea and near

GBP/CHF: Trendline or RSI — Which One Is Lying?
Sterling enters this week on firmer footing, with political uncertainty fading fast after Andy Burnham's confirmation as Labour leader eased investor concerns over the succession to Keir Starmer. Markets reacted further to reports pointing to Shabana Mahmood as the frontrunner