


LTC/USD and EOS/USD are showing weakness with downside expected
FXOpen
LTC/USD
From Monday’s open when the price of Litecoin was at its highest point in a while as it has reached $64.111, the price has decreased by 8.92% measured to its lowest point today at $58.38.
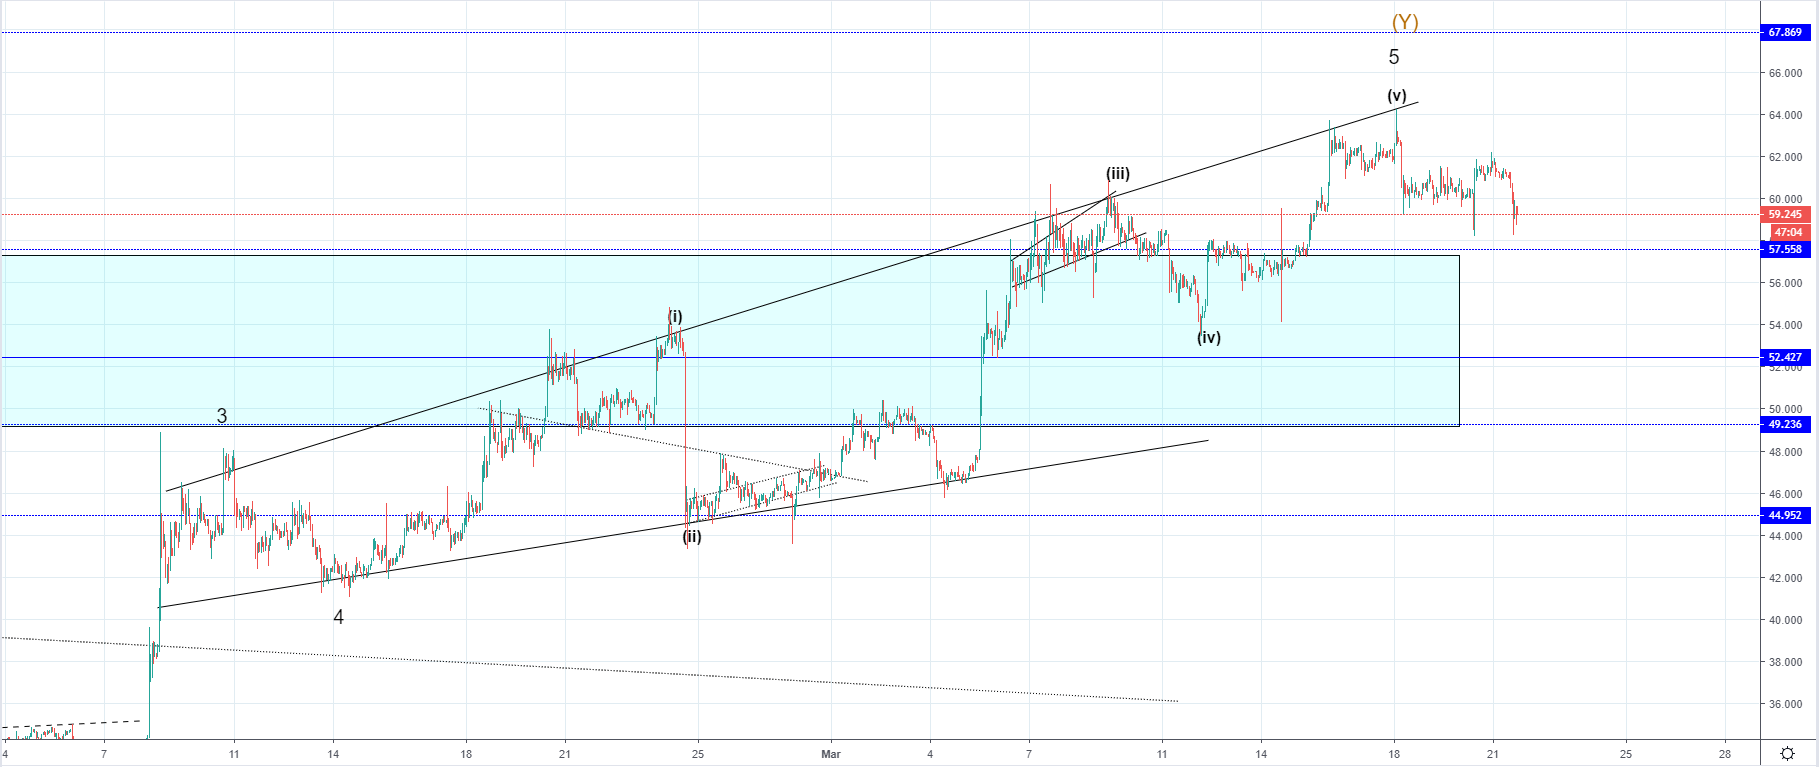
On the hourly chart, you can see that the price of Litecoin interacted with the resistance line from the expanding triangle which is viewed as an ending diagonal on the 5th impulse wave. Now that it has ended and another retest of resistance occurred the price started moving to the downside and is currently retesting the support at the prior range resistance. Judging by the momentum I don’t believe that the level is going to serve as support for much longer as it is only a minor support/resistance point and considering that the price has moved above the resistance zone I retest of its levels for support would be more likely.
If the 5th wave ended the price is set to go below the resistance zone again as the Intermediate Y wave ended which is why from here more downside would be expected for the price of Litecoin.
EOS/USD
From Monday’s open at $3.8525 we have seen a decrease of 6.08% measured to the lowest point the price has been today at $3.618 around which the price is currently being traded and is in a downward trajectory.
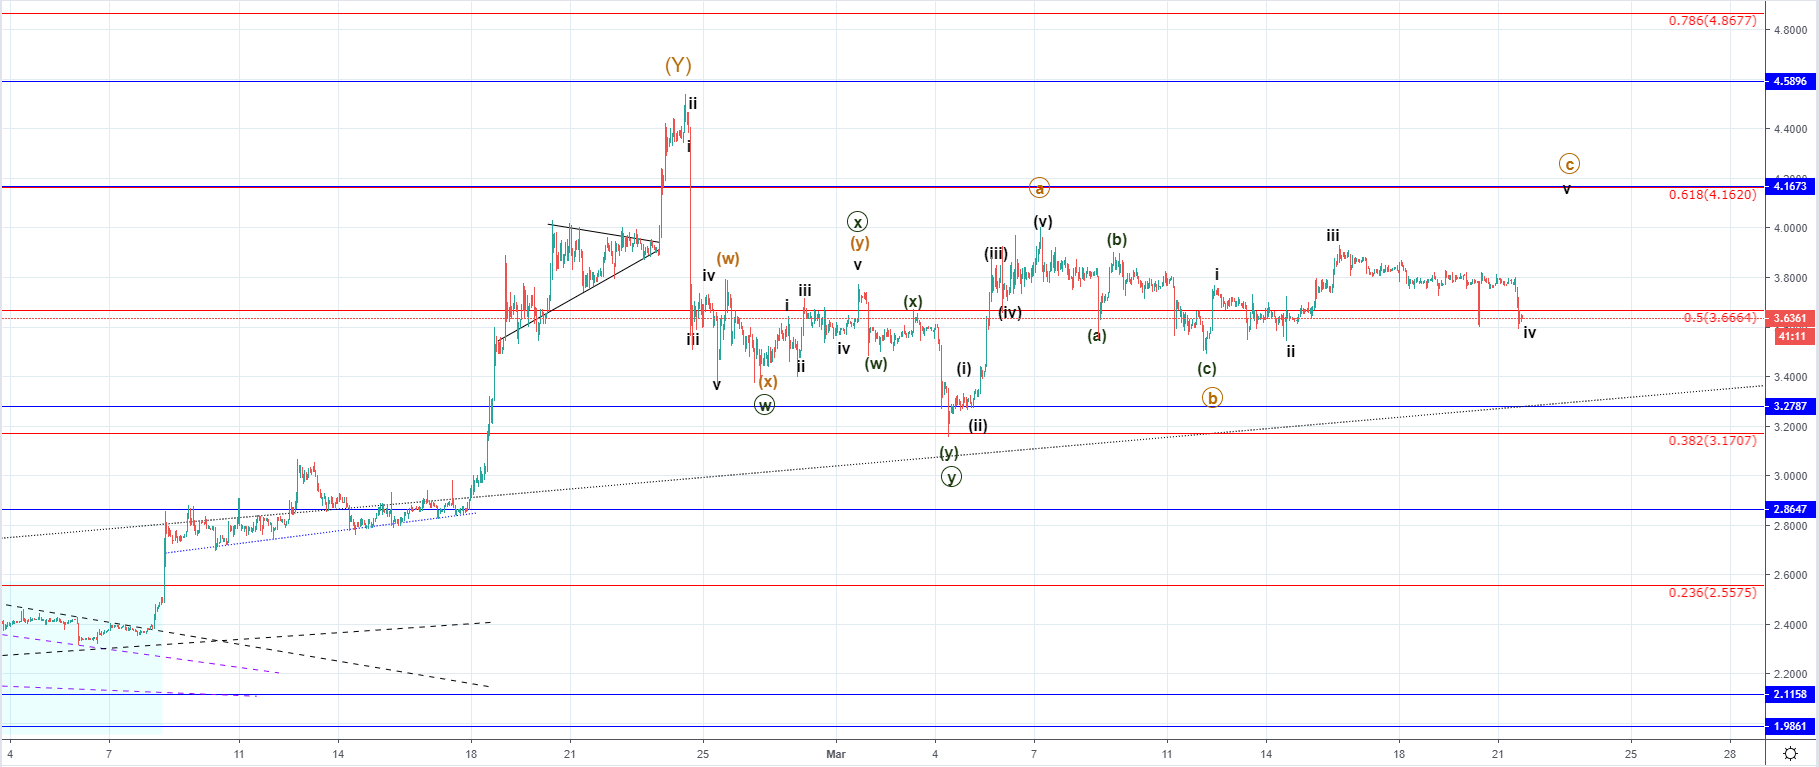
On the hourly chart, you can see that the price of EOS is back to around 0.5 Fibonacci level where it is searching for support and is currently below it. The price of EOS has some more upside potential before we see an impulsive decrease to the downside like presumably started in the case of Bitcoin but we could also be seeing the start of the next structure to the downside. If the price continues moving upward as this was the 4th wave out of the five-wave move to the upside I would expect to see the price of EOS around $4.162 before the start of the impulsive decrease.
The C wave would develop to the upside as the price is set to complete the five-wave move but if this previous wave ended as a three wave move then we are already seeing the start of the next move to the downside.
This would soon be validated by the support or the lack of support around the current levels as the 4th wave can’t enter the territory of the second wave and the price has come to its resistance levels, so if it continues moving lower the count would be invalidated which would mean that the third correction or an impulse wave to the downside has most likely started.
FXOpen offers the world's most popular cryptocurrency CFDs*, including Bitcoin and Ethereum. Floating spreads, 1:2 leverage — at your service (additional fees may apply). Open your trading account now or learn more about crypto CFD trading with FXOpen.
*Important: At FXOpen UK, Cryptocurrency trading via CFDs is only available to our Professional clients. They are not available for trading by Retail clients. To find out more information about how this may affect you, please get in touch with our team.
This article represents the opinion of the Companies operating under the FXOpen brand only. It is not to be construed as an offer, solicitation, or recommendation with respect to products and services provided by the Companies operating under the FXOpen brand, nor is it to be considered financial advice.
Stay ahead of the market!
Subscribe now to our mailing list and receive the latest market news and insights delivered directly to your inbox.


Latest articles

Apple: Earnings Day Above the Activity Zone
On 30 April, after the market close, Apple Inc. will release its financial results for the second quarter of fiscal 2026. The consensus forecast, based on estimates from 31 analysts, points to revenue of around $109.7 billion, with expected

USD/JPY and USD/CHF Near Key Levels: The Dollar Supported by the Fed
The US dollar continues to trend upwards following the Federal Reserve meeting, drawing support from the regulator’s moderately hawkish stance and comments by Jerome Powell. Markets interpret the Fed’s rhetoric as a signal that restrictive policy is likely

EUR/USD and GBP/USD consolidate ahead of the Fed decision
European currencies are showing subdued dynamics, entering a consolidation phase following their previous advance. Earlier, EUR/USD and GBP/USD broke out of their ranges and strengthened; however, the subsequent correction has led both pairs to retest the previously breached