


FXOpen
LTC/USD
Since last Thursday when the price of Litecoin was $32.3 things haven’t changed much as the price is currently at the same levels.
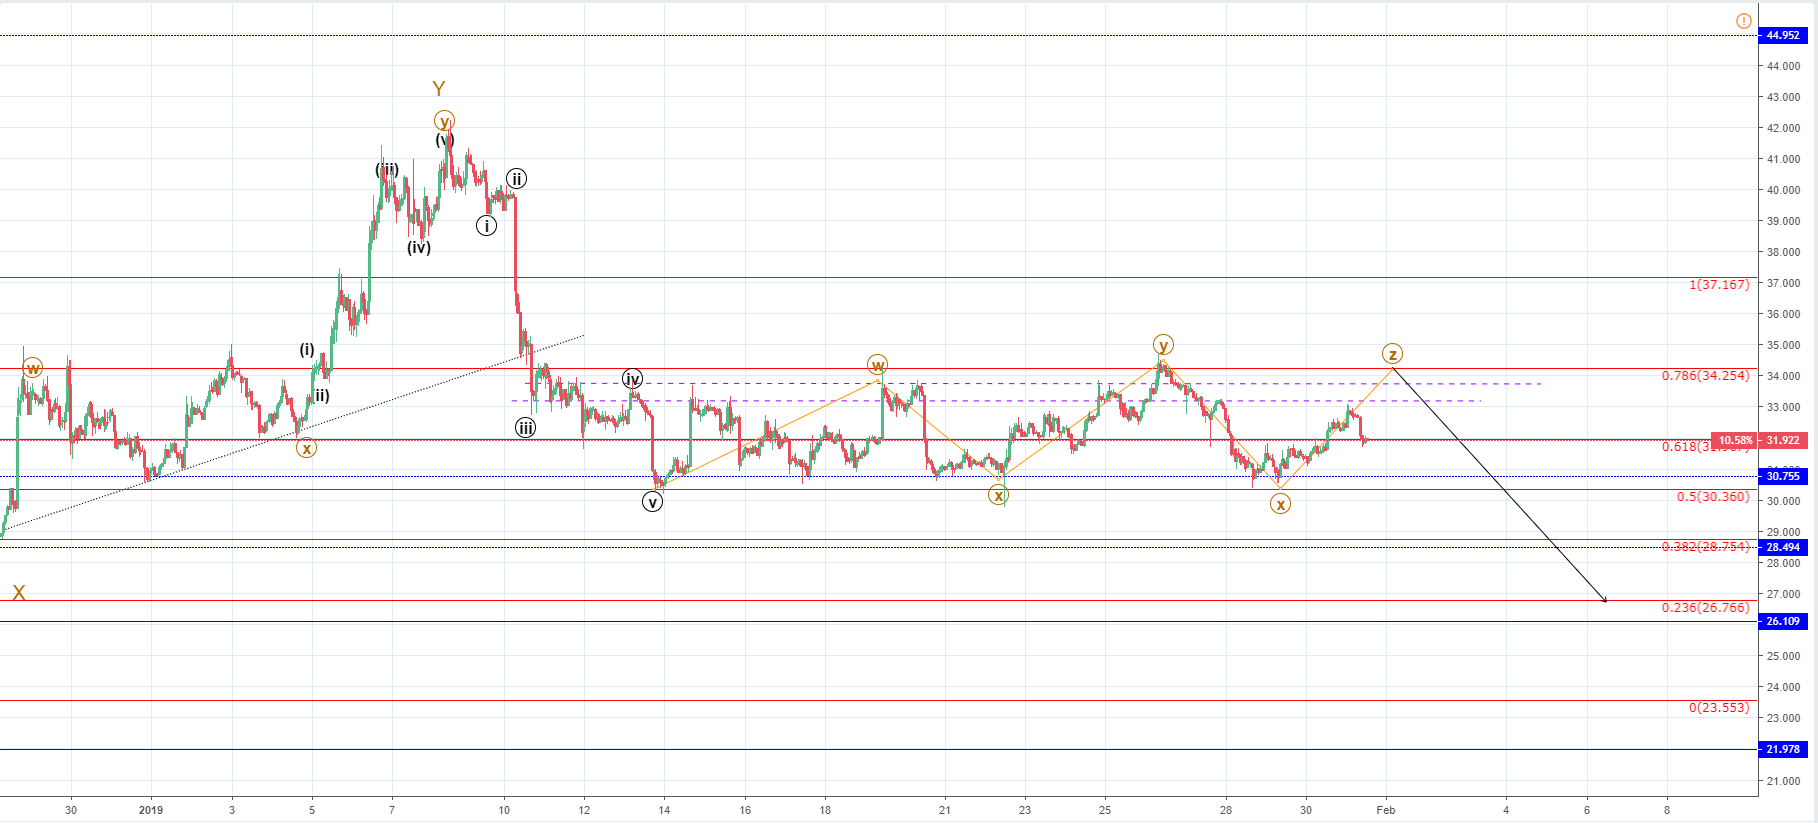
Looking at the hourly chart, you can see that this didn’t happen in a straight line as the price of Litecoin went further up and came to $34.254 from last Thursday’s price, which was on the 0.786 Fibonacci level. But since the price encountered resistance there it was rejected and went down to the next horizontal level to find support, which was slightly above the 0.5 Fibonacci level or in price terms at $30.755.
Since the price found support there it started increasing again but has been stopped out at the lower level of the horizontal resistance range, where the price has been stuck since the 14th of January. A breakout from the range on the downside now is likely, but since the price is interacting with the 0.618 Fibonacci level we are soon going to see how likely it is. Since the price hasn’t gone further up making a higher high, and instead formed a lower high, actually the lowest inside the range, in which the price is currently, we can assume that the bullish momentum is slowing down.
Looking at the wave structure, you can see that after the price came all the way to $41.7 it started moving down impulsively in a five wave manner. When this move ended a sideways correction took place, so the horizontal range was formed. The first correction inside the range ended on the interaction with the 0.786 Fibonacci level so what we are currently seeing is either another correction or the start of another impulsive move to the downside.
The previous WXY correction (orange) might get prolonged by two more waves. In such a case another increase would happen to the 0.786 Fibonacci level before it ends, but in either way I would be expecting more downside for the price of Litecoin in the upcoming period.
EOS/USD
Since last Thursday when the price of EOS was at $2.471 measured to the current level of $2.3511, the cryptocurrency has depreciated in value by around 5%.
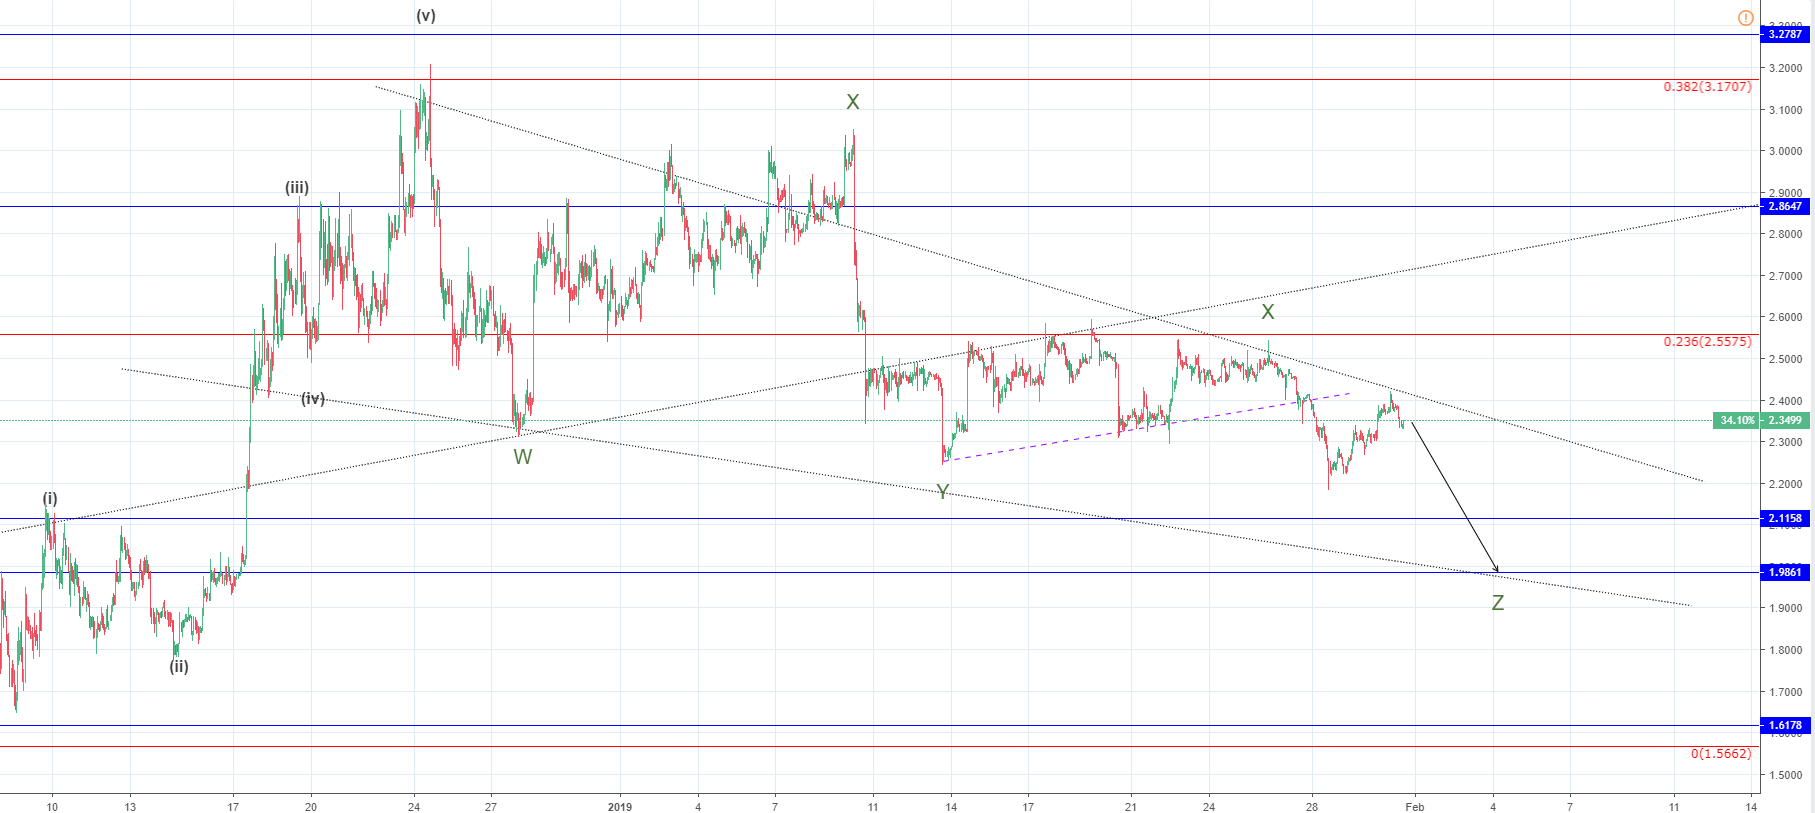
The price at first increased from there to the 0.236 Fibonacci level or in price term at $0.25575. But since it encountered strong resistance there it got pushed back down and the price went lower than the previous time on the Minor Y wave, making a lower low, which is also happening next, since the price came up from there but was stopped out at the descending channel resistance line.
If the minor WXYXZ correction is to end soon, it is likely going to end on the descending channels support line, which was formed by the correction. So my target for the expected decrease would be at the intersection of the descending channel and the horizontal level at $1.9757. The support line from the descending channel could be drawn differently as to include the last two downside point. In such a case the target would be higher potentially ending on the upper horizontal level at $2.11.58, but in either way more downside is expected from here.
FXOpen offers the world's most popular cryptocurrency CFDs*, including Bitcoin and Ethereum. Floating spreads, 1:2 leverage — at your service. Open your trading account now or learn more about crypto CFD trading with FXOpen.
*At FXOpen UK and FXOpen AU, Cryptocurrency CFDs are only available for trading by those clients categorised as Professional clients under FCA Rules and Professional clients under ASIC Rules respectively. They are not available for trading by Retail clients.
This article represents the opinion of the Companies operating under the FXOpen brand only. It is not to be construed as an offer, solicitation, or recommendation with respect to products and services provided by the Companies operating under the FXOpen brand, nor is it to be considered financial advice.
Stay ahead of the market!
Subscribe now to our mailing list and receive the latest market news and insights delivered directly to your inbox.

Latest articles

Weekly Market Wrap With Gary Thomson: Nasdaq, EUR/USD, USD/CHF, Brent Crude Oil, Googl Shares
Get the latest scoop on the week's hottest headlines, all in one convenient video. Join Gary Thomson, the COO of FXOpen UK, as he breaks down the most significant news reports and shares his expert insights.
- Nasdaq Composite: Worst Session

Analysis of AUD/USD: Exchange Rate Falls to Early May Low
As indicated by the 4-hour AUD/USD chart today:
→ the rate fell below 0.652, a level last seen on May 2;
→ the RSI indicator dropped below 15, a level last seen during the panic over the spread of COVID-19

Analysis of AMZN Stock: Price at 1.5-Month Low
As shown in the AMZN chart, the stock price dropped below:
→ the psychological level of $180;
→ the mid-June interim low.
The last time AMZN traded below $180 was in early June.
Thus, AMZN has faced sell-offs, similar to other tech