


LTC/USD and EOS/USD - Further increase expected but not for long
FXOpen

LTC/USD
From Monday’s open when the price of Litecoin was sitting at $71.8, we have seen the price decreasing by about 7% as it came down to $66.7 at its lowest point on the next day. After this minor retracement, the price continued moving to the upside and reached $74.23 at its highest point today which is an increase of 11%. Currently, the price is still being traded above the prior high but is sitting slightly lower than at it’s highest today.
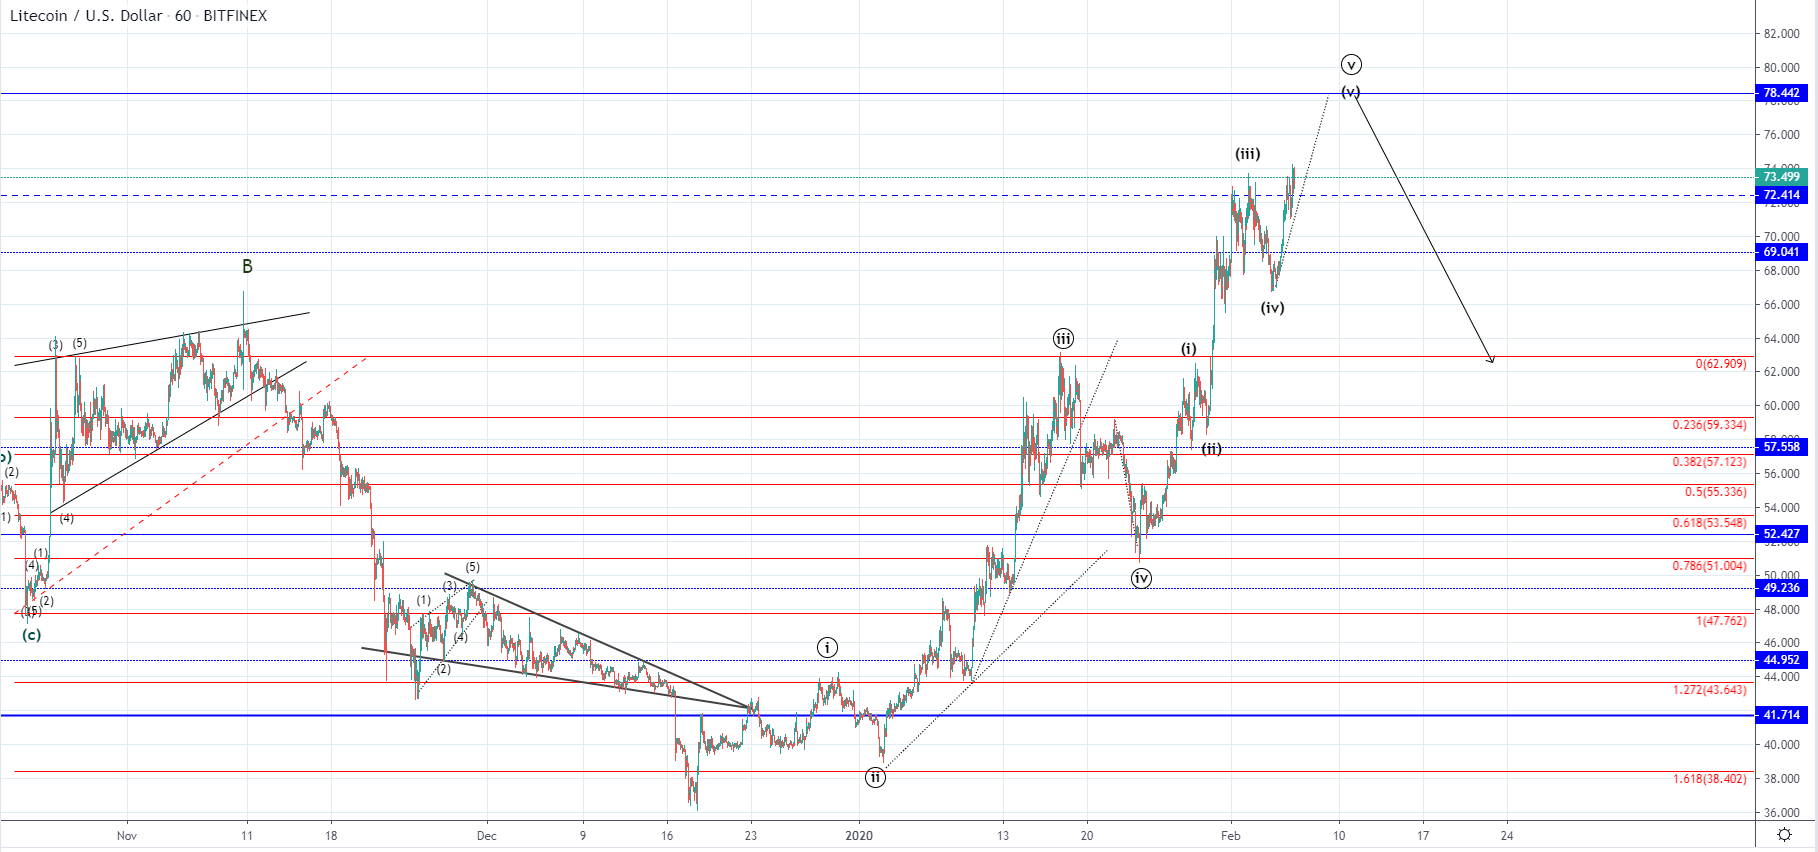 On the hourly chart, you can see that the price came above the prior high which is considered the 3rd wave out of the lower degree count from the 5 waves of the higher degree (Minute) one. This means that we are most likely seeing the 5th wave out of both counts developing to the upside and projecting the length of the first wave on to the presumed 4th we come up with an optimal price target of around $78.4 for its ending point.
If we are seeing the development of the five-wave impulse from the 18th of December last year the downside move which is expected to follow would be the 2nd wave of an even higher degree and could bring the price of Litecoin significantly lower then now projected, but first more upside should be expected as the 5th wave is yet to be completed.
EOS/USD
In the case of EOS we can see a similar situation like on Litecoin’s chart, as the price continued increasing after a minor retracement since the start of the week. From Tuesday’s low at $4 the price gainer 13.72% coming to $4.6262 at it’s highest point today, around which it is still currently being traded.
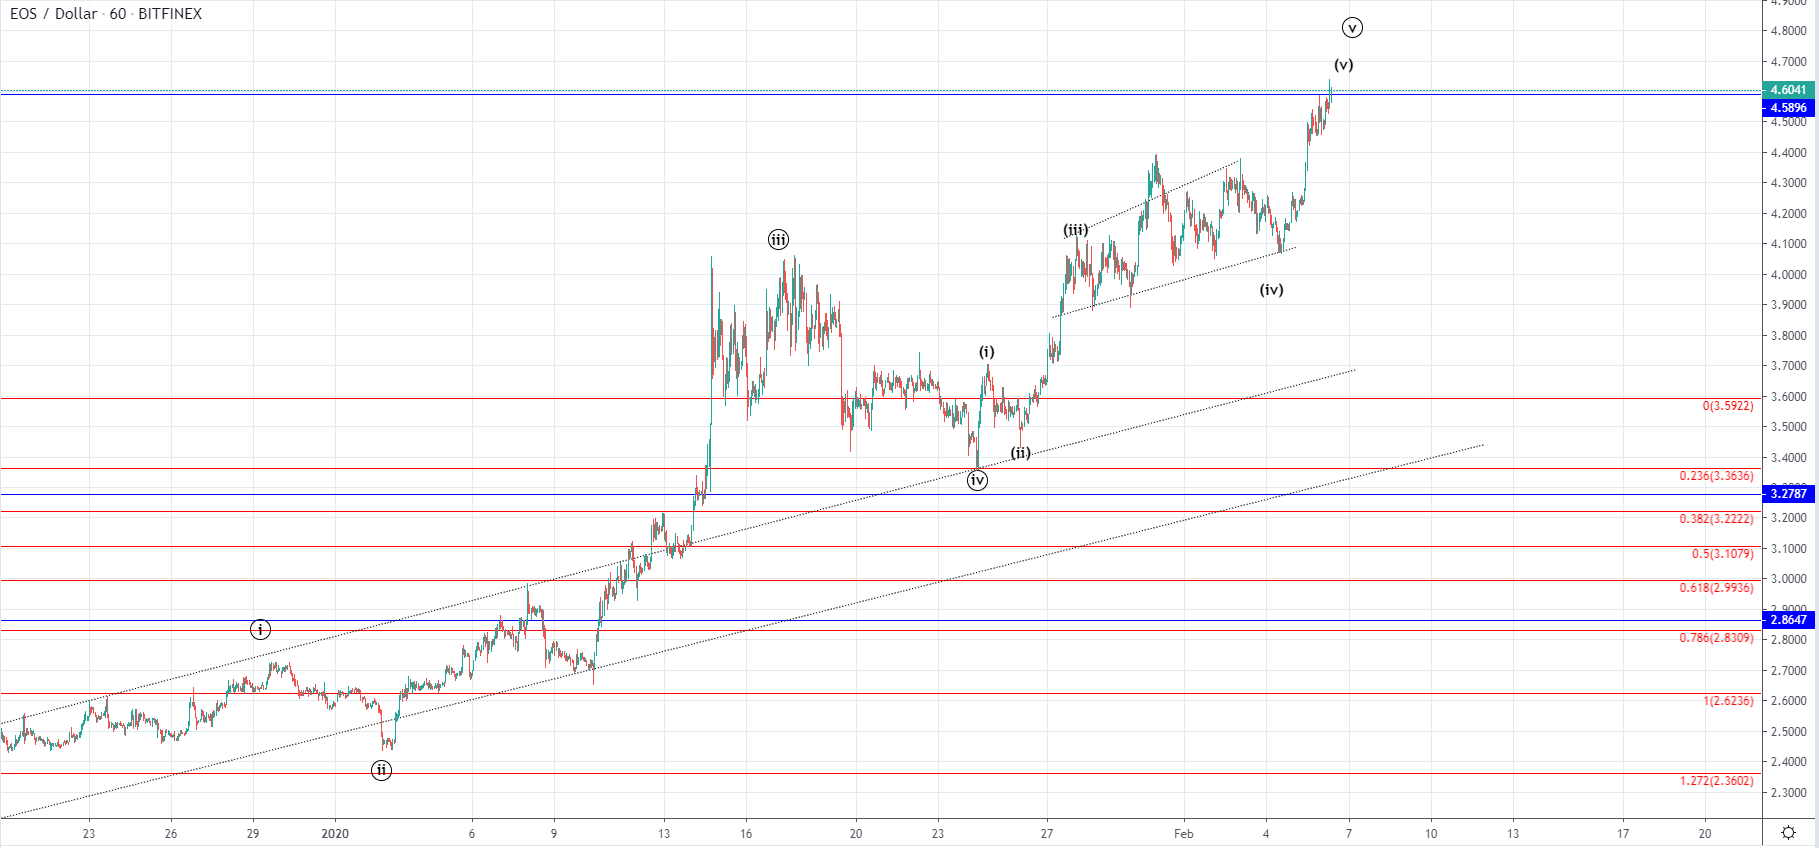 Looking at the hourly chart, you can see that it reached a horizontal level which isn’t as significant one but could provide an early indication that the 5th wave could have ended or is near completion as the price is starting to enter the upper range.
From December last year when the price of EOS was sitting at it’s yearly low at $2.12 we have seen an increase of 117% which is why most likely this increase is coming shortly to an end with either the first major retracement in a starting uptrend or further downtrend continuation. This will depend on the price momentum to the downside from which we are to evaluate the possibilities, but in either way further increase would be expected before this starts.
FXOpen offers the world's most popular cryptocurrency CFDs*, including Bitcoin and Ethereum. Floating spreads, 1:2 leverage — at your service (additional fees may apply). Open your trading account now or learn more about crypto CFD trading with FXOpen.
*Important: At FXOpen UK, Cryptocurrency trading via CFDs is only available to our Professional clients. They are not available for trading by Retail clients. To find out more information about how this may affect you, please get in touch with our team.
This article represents the opinion of the Companies operating under the FXOpen brand only. It is not to be construed as an offer, solicitation, or recommendation with respect to products and services provided by the Companies operating under the FXOpen brand, nor is it to be considered financial advice.
Stay ahead of the market!
Subscribe now to our mailing list and receive the latest market news and insights delivered directly to your inbox.


Latest articles

DAX 40: consolidation amid technology sell-off
A wave of selling in the technology sector that emerged earlier this week has weighed on European equities. The trigger was investor concern over the profitability of large-scale debt-funded investments by major US tech companies in AI infrastructure. The Nasdaq

Euro Hits Fresh Yearly Lows Amid Dovish ECB Signals
The euro remains under pressure following weak macroeconomic data from the euro area and fresh signals that the European Central Bank is prepared to maintain a more accommodative monetary policy stance. Data released yesterday pointed to a deterioration in business

Pound at Key Levels: Markets Assess Impact of Political Uncertainty in the UK
The British pound remains under pressure following increased political uncertainty in the United Kingdom triggered by the Prime Minister’s resignation. Investors are assessing potential shifts in the political and economic policy outlook after the head of government stepped down,