


LTC/USD and EOS/USD in a corrective increase
FXOpen
LTC/USD
From last Thursday when the price of Litecoin was around $61.58 we have seen sideways movement in a range between the resistance level at $62.5 and the support at $58.2. Today the price has retested the horizontal resistance level of the mentioned sideways range and is currently sitting around $61.613.
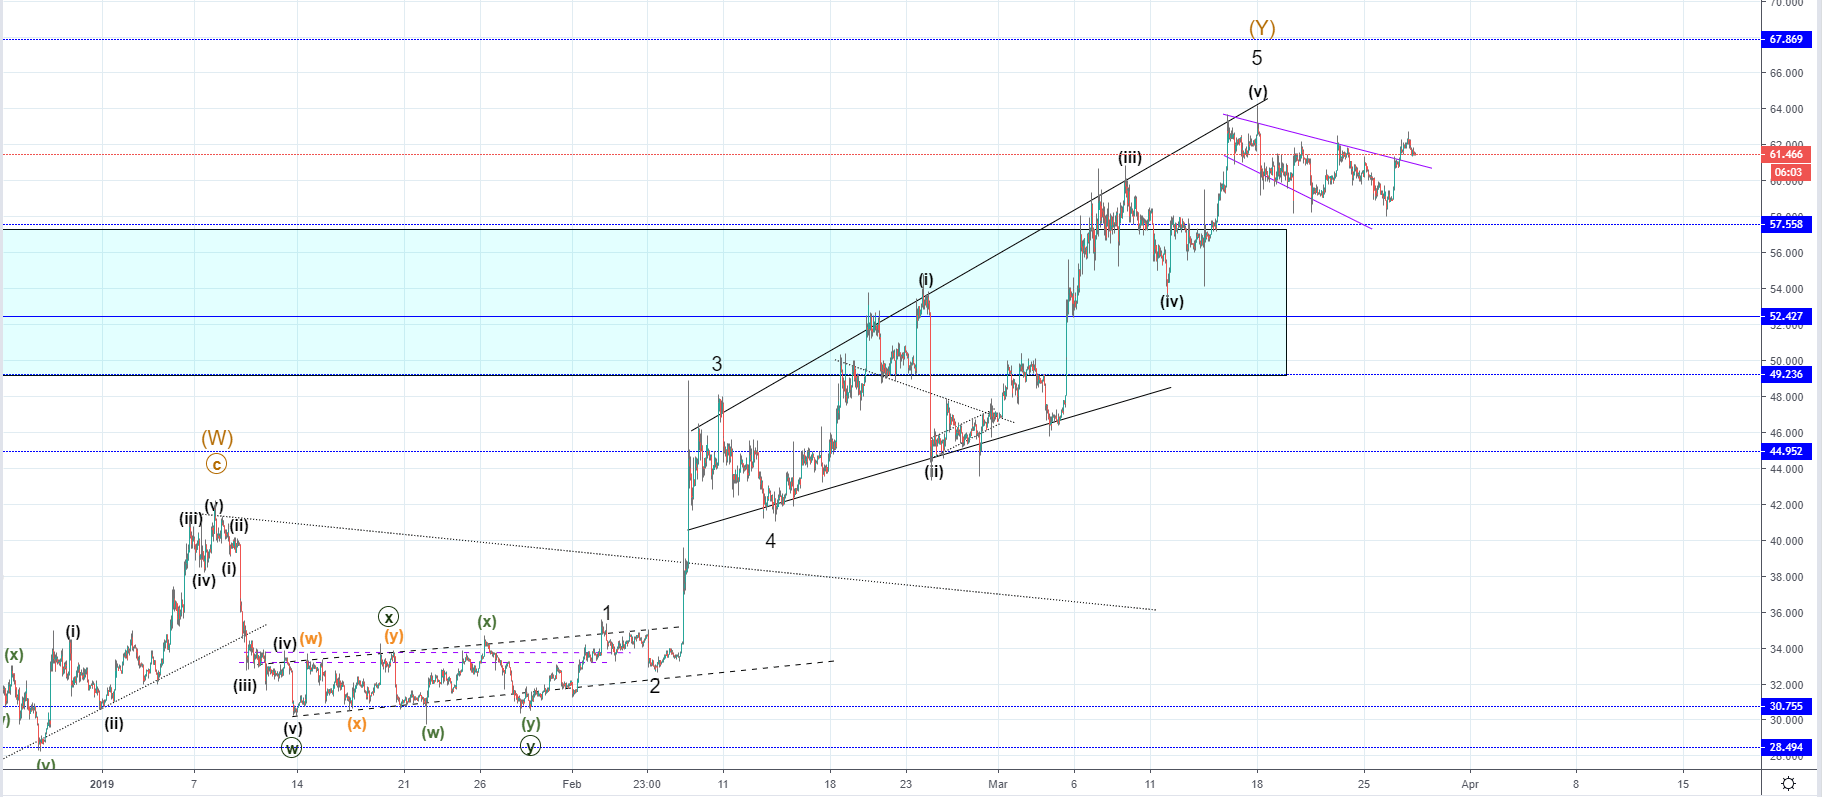
On the hourly chart, we can see that the price of Litecoin ended its five-wave to the upside. It formed a descending structure after. Today the price broke its resistance line but was stopped out at the minor horizontal resistance level with the price currently being in a downward trajectory. As the price is still above the resistance zone I was expecting a retest of its significant level at $57.558 which hasn’t occurred, but the price fell close to it on Tuesday coming to $58.
This could indicate that the retested support was there as the price started increasing after and it came up by 7.23% on the last increase. Considering that we have most likely seen the end of the five-wave impulse wave to the upside in an ending diagonal, we are most likely seeing the development of the now expected downside movement which could be either corrective if the intermediate correction is to get prolonged or an impulsive move if the correction ended.
In either way, the increase we have seen ending today was most likely corrective and would be viewed as such until the price exceeds the prior high at around $68.
EOS/USD
The price of EOS has increased by over 21% from Monday’s low at $3.6283 as it came up to $4.3934 at its highest point today. The price is currently sitting slightly lower at $4.221 and has started consolidating after a parabolic increase but is still in an upward trajectory overall.
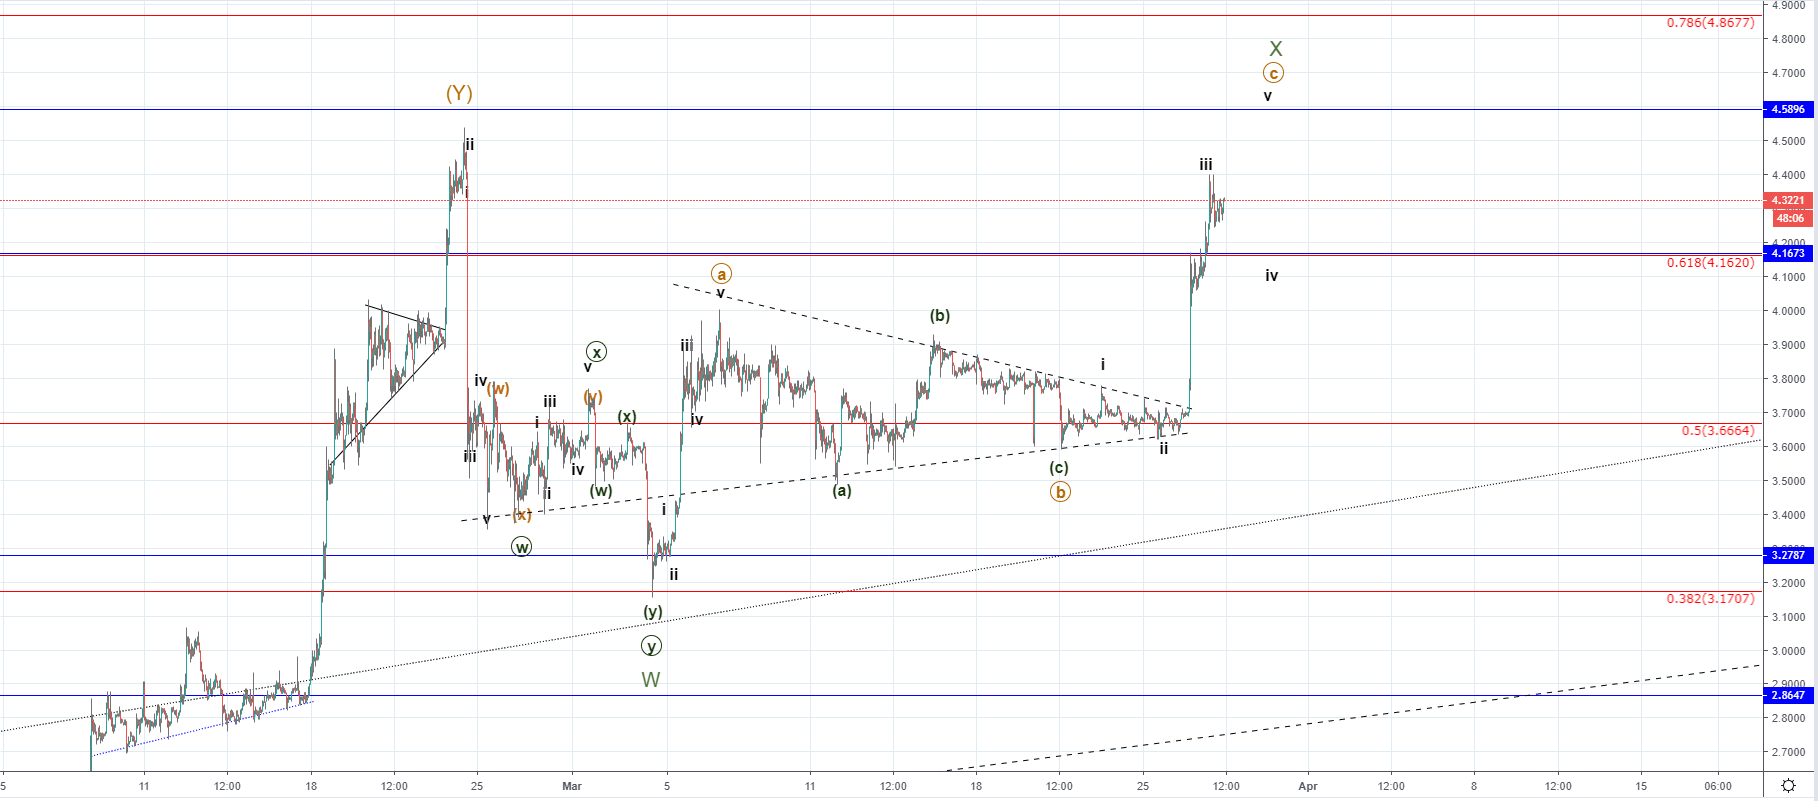
Looking at the hourly chart, you can see that the price of EOS went above the 0.618 Fibonacci level which served as strong resistance pointing to strong momentum but still hasn’t exceeded the prior high at around $4.5 level. This movement was expected as the C wave out of the second three wave correction to the upside was to start developing and now it looks like there is still more room to go before the increase ends.
As the C wave develops in five waves and the price action is currently showing three, a minor retracement would be expected before another increase. The minor retracement could be to the broken resistance point around the 0.618 Fibonacci level which would be a retest for support, or the price could fall below it in which case the next significant support point would be at the broken range resistance around $3.87. The increase for the expected 5th wave could end around the vicinity of the prior high or it could continue moving slightly up to around $4.589 which is another significant resistance level.
As this movement is most likely corrective in nature after it ends I would be expecting further trend continuation to the downside.
FXOpen offers the world's most popular cryptocurrency CFDs*, including Bitcoin and Ethereum. Floating spreads, 1:2 leverage — at your service (additional fees may apply). Open your trading account now or learn more about crypto CFD trading with FXOpen.
*Important: At FXOpen UK, Cryptocurrency trading via CFDs is only available to our Professional clients. They are not available for trading by Retail clients. To find out more information about how this may affect you, please get in touch with our team.
This article represents the opinion of the Companies operating under the FXOpen brand only. It is not to be construed as an offer, solicitation, or recommendation with respect to products and services provided by the Companies operating under the FXOpen brand, nor is it to be considered financial advice.
Stay ahead of the market!
Subscribe now to our mailing list and receive the latest market news and insights delivered directly to your inbox.


Latest articles

Pound at Key Levels: Markets Assess Impact of Political Uncertainty in the UK
The British pound remains under pressure following increased political uncertainty in the United Kingdom triggered by the Prime Minister’s resignation. Investors are assessing potential shifts in the political and economic policy outlook after the head of government stepped down,

Silver: Fed Tightens Its Tone as Price Returns to the Volume Profile Zone
Silver came under pressure following the Federal Reserve’s June meeting, at which policymakers kept interest rates unchanged at 3.50–3.75%. Nine of the 18 committee members still see the possibility of a rate increase this year, reinforcing

Ethereum: Market Assesses the Strength of the Corrective Recovery
Following a period of heightened volatility in early June, investor attention in Ethereum has once again shifted towards institutional demand and the development of the spot ETF market in the United States. The funds launched last year continue to serve