


LTC/USD and EOS/USD: Is the bullish period over?
FXOpen
LTC/USD
From Monday’s open at $113.554 the price of Litecoin has increased by 25.66% as it came up to $142.68 at its highest point today. Since then the price has fallen by around 6% and is currently being traded at $134.73 with the price action forming a horizontal cluster.
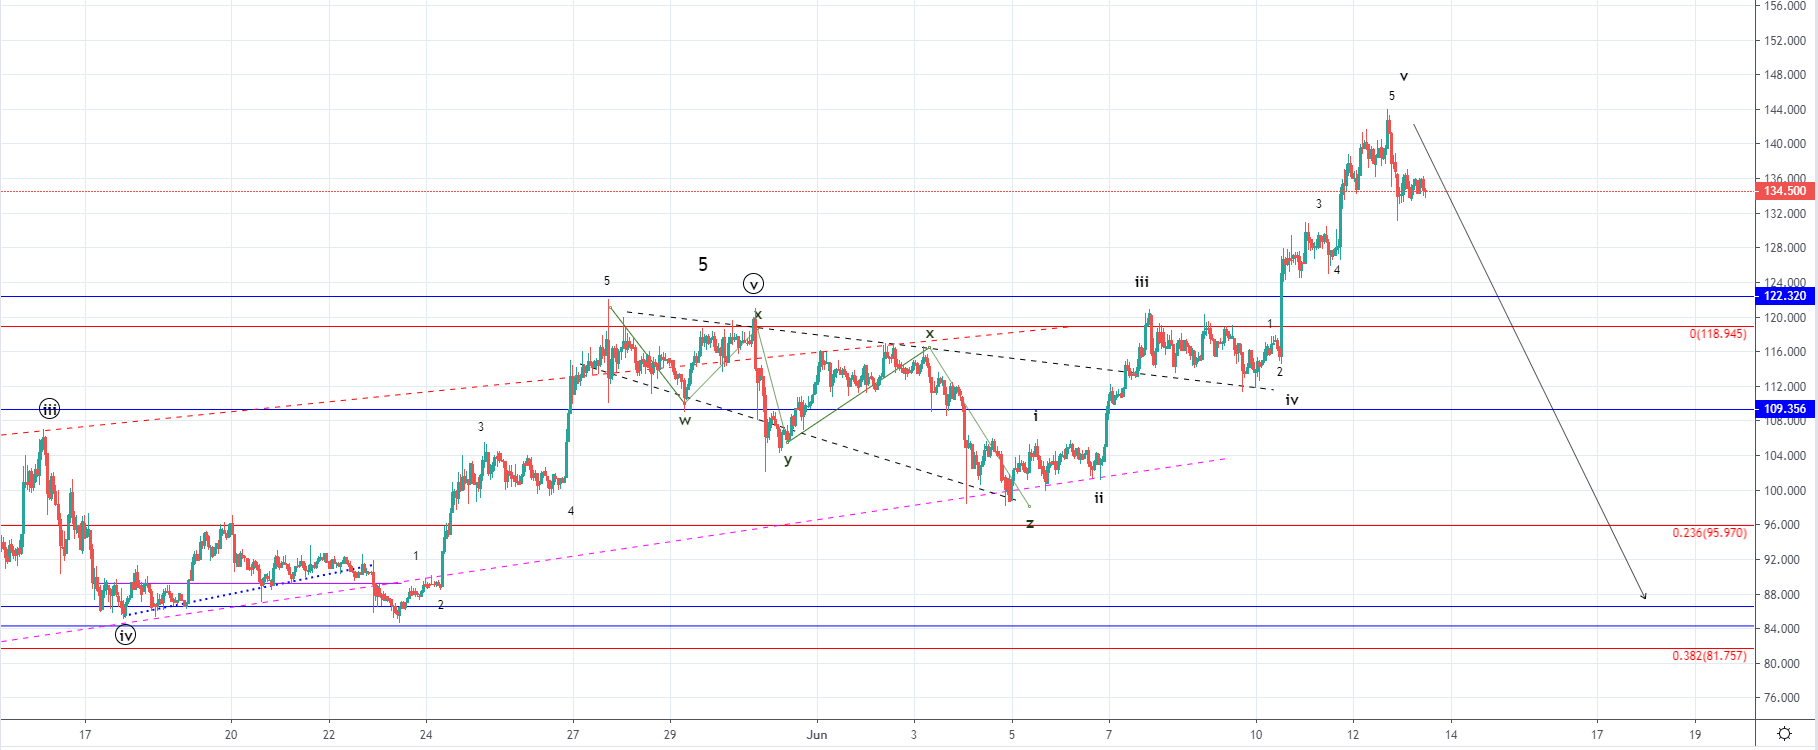
On the hourly chart, you can see that since Monday we have seen an increase in a five-wave manner which has pushed the price above some of the significant resistance points. The first major resistance broken was at the prior high at around $118.94 while the next one was at $122.32 above which it is considered to be the sellers’ territory. As the price made a five-wave increase which is most likely the 5th wave from the impulse wave of the higher degree which started on the 5th of June we have likely seen its completion.
The price has entered the territory above the significant horizontal level at $122.32 which is considered to be the upper level of the resistance zone above which is the sellers’ territory. Since the price moved impulsively the momentum was enough for a breakout but the price hasn’t come down to some of the broken resistance levels for a retest of support before it continued moving to the upside further which makes the rise more unsustainable.
Considering that we have seen the completion of the five-wave increase and that the price has entered the seller’s territory we are now likely to see a move to the downside. The move to the downside might have already started as the price decreased impulsively and started forming a horizontal cluster. I would be expecting the price to go at least to some of the broken resistance points for a retest of support, but if we have seen the completion of the Minor count five-wave impulse the price would continue moving further to the downside back inside the territory of the lower range with the first strong support zone being at around $83.
EOS/USD
From Monday the price of EOS has been on the rise and has made an increase of 9.75% coming from $6.04 to $6.63 at its highest point today. The price has started showing signs of weakness slightly below the prior high and is starting to move to the downside again, currently being traded at around $6.5.
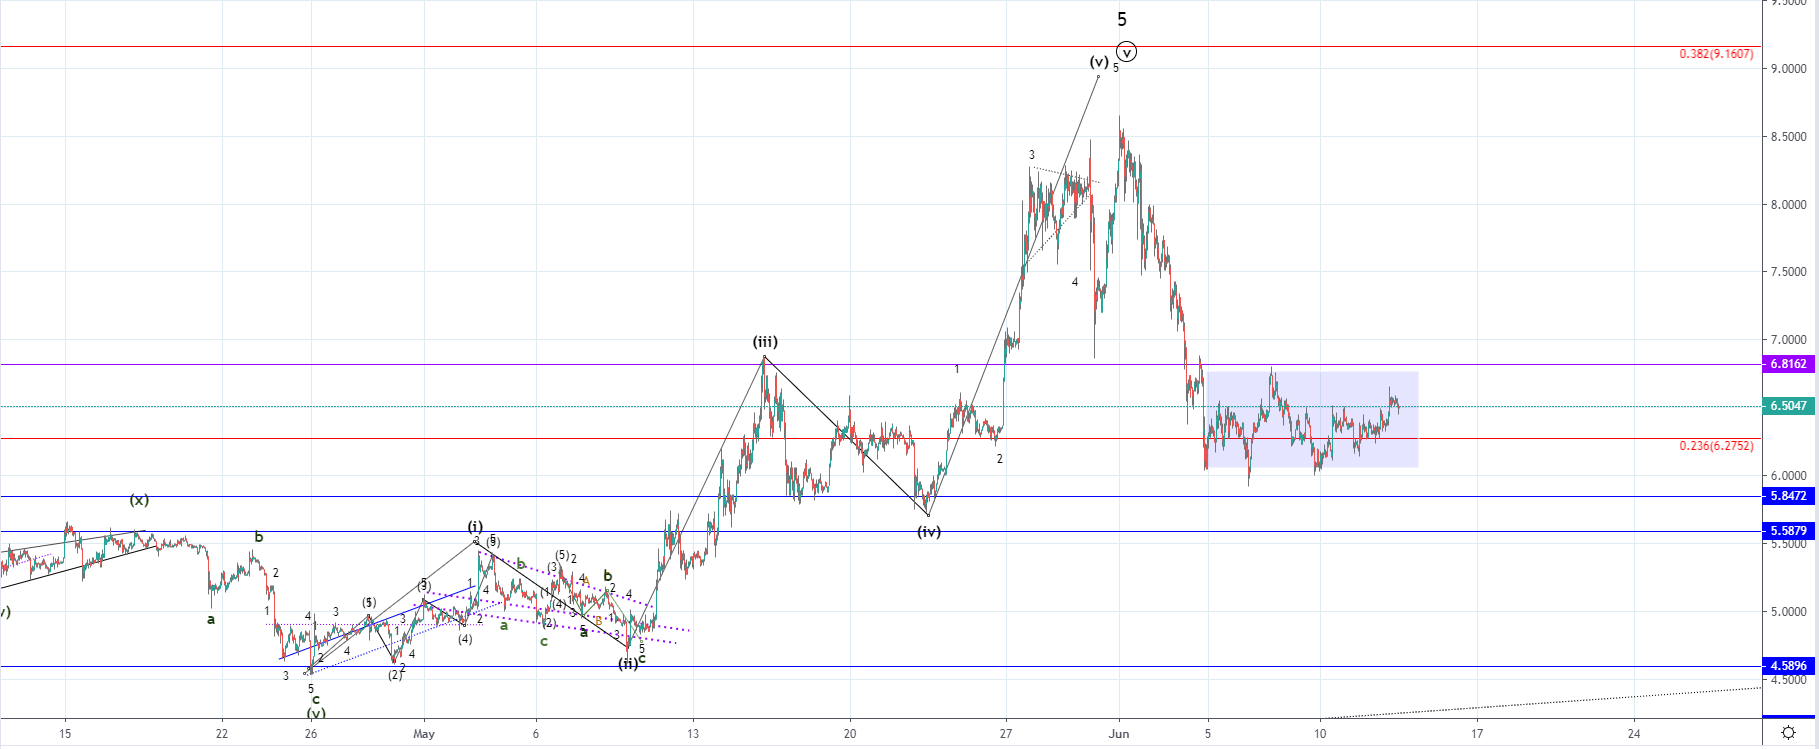
On the hourly chart, we can see that the price action formed a horizontal range after a downfall of over 29% which started since the beginning of June. The range has been formed below the significant horizontal level at $6.816 and the 0.236 Fibonacci level which serves as a pivot point. The price moved below the Fib level but managed to pull back above quickly after which indicates that the buyers and the sellers are consolidating with unclear sing of control over the price.
As we’ve seen the completion of the five-wave impulse to the upside of a higher Minor degree a downfall of 29% could have been the first impulsive wave out of the downward move which was expected to play out as a starting downtrend. If the downtrend started this horizontal range would be its second wave which is corrective in nature and could lead the price back above the significant horizontal level at $6.816 before another downturn.
Another possibility would be that the decrease of 29% was another correction before the uptrend continuation but considering that the price of EOS was in a bullish period in which it recovered by over 415% from 7th of December last year I believe that more likely we are going to see further downside as a correction of the same degree in which case the first significant support zone would be at around $4.3
FXOpen offers the world's most popular cryptocurrency CFDs*, including Bitcoin and Ethereum. Floating spreads, 1:2 leverage — at your service (additional fees may apply). Open your trading account now or learn more about crypto CFD trading with FXOpen.
*Important: At FXOpen UK, Cryptocurrency trading via CFDs is only available to our Professional clients. They are not available for trading by Retail clients. To find out more information about how this may affect you, please get in touch with our team.
This article represents the opinion of the Companies operating under the FXOpen brand only. It is not to be construed as an offer, solicitation, or recommendation with respect to products and services provided by the Companies operating under the FXOpen brand, nor is it to be considered financial advice.
Stay ahead of the market!
Subscribe now to our mailing list and receive the latest market news and insights delivered directly to your inbox.


Latest articles

Apple: Earnings Day Above the Activity Zone
On 30 April, after the market close, Apple Inc. will release its financial results for the second quarter of fiscal 2026. The consensus forecast, based on estimates from 31 analysts, points to revenue of around $109.7 billion, with expected

USD/JPY and USD/CHF Near Key Levels: The Dollar Supported by the Fed
The US dollar continues to trend upwards following the Federal Reserve meeting, drawing support from the regulator’s moderately hawkish stance and comments by Jerome Powell. Markets interpret the Fed’s rhetoric as a signal that restrictive policy is likely

EUR/USD and GBP/USD consolidate ahead of the Fed decision
European currencies are showing subdued dynamics, entering a consolidation phase following their previous advance. Earlier, EUR/USD and GBP/USD broke out of their ranges and strengthened; however, the subsequent correction has led both pairs to retest the previously breached