


LTC/USD and EOS/USD - more downside expected
FXOpen
LTC/USD
At the moment of our last week’s analysis on Thursday, December 6th, the price of Litecoin was around $25.8. From there the price went down to around $23.2 and even spiked further down but the hourly candle has closed above leaving a wick on the hourly chart as you can see below. From there the price went to recover and has increased to $27 but fell again to $23.7.
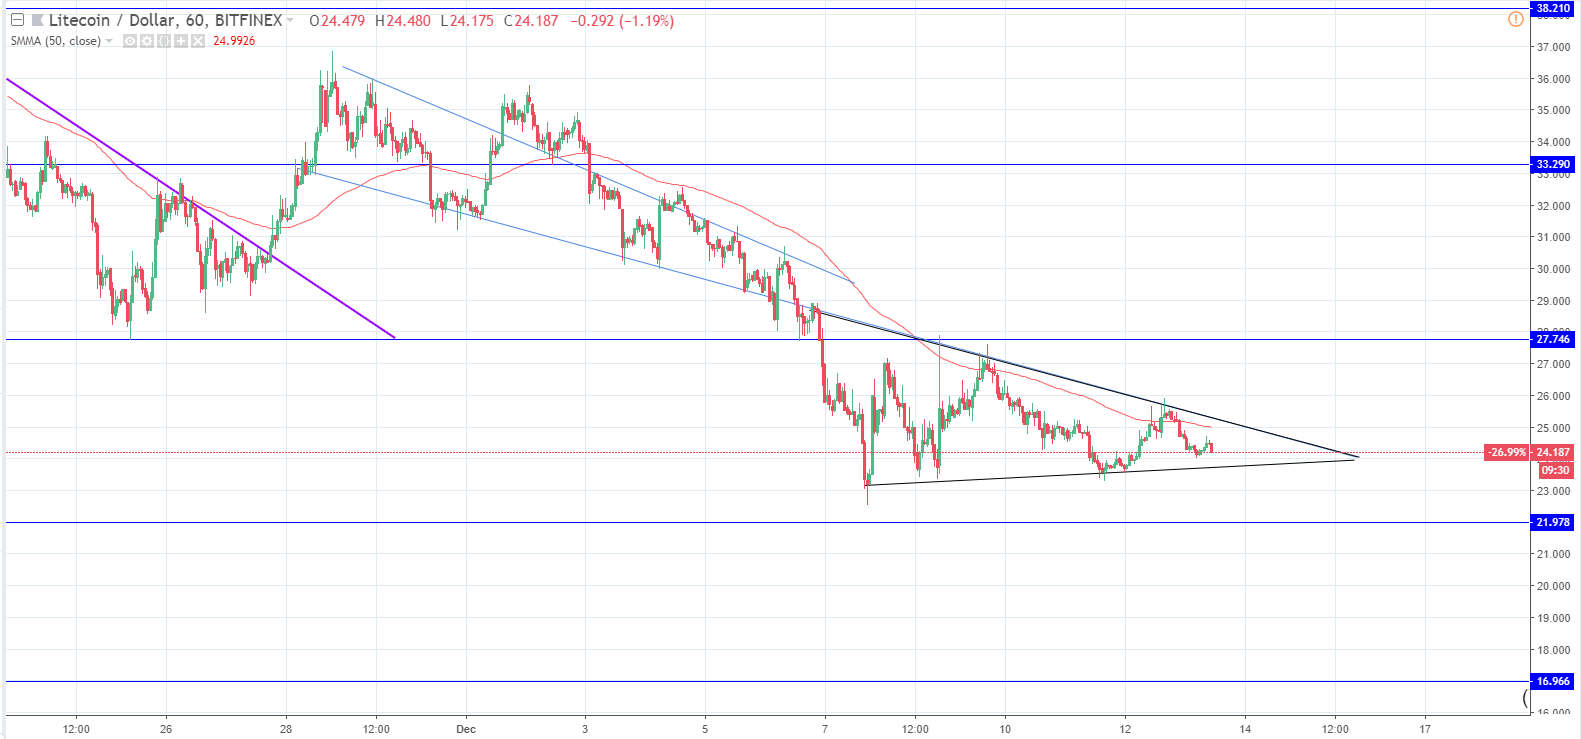
This continued and the price action has formed a triangle, which looks like a bearish pennant considering the price action context. Its resistance line is the support from the previous structure and it was well respected in the past both on the previous structure as support and now as resistance.
Currently, the price is in a downward trajectory as it was rejected at around the 50-hour SMMA and judging by the price action we are going to see another interaction with the triangles support line again.
This interaction may lead to a breakout from the downside in which case I would be looking at $21.98 for the target as this is the next horizontal support level in line that is significant and strong enough to withhold the sell-off momentum.
If the price goes up, however, and we see a breakout from the upside, I wouldn’t expect the price to go further than the resistance at $27.75 where the previous high level is, because this current triangle structure is a correction after a down move so a trend continuation is expected.
This means that in either case I would expect to see the price significantly lower but this might not happen in a straight line.
EOS/USD
From last Thursday, when the price of EOS was $2.2642 at the open, to the current levels of $1.9959 the crypto has decreased in price by 11%.
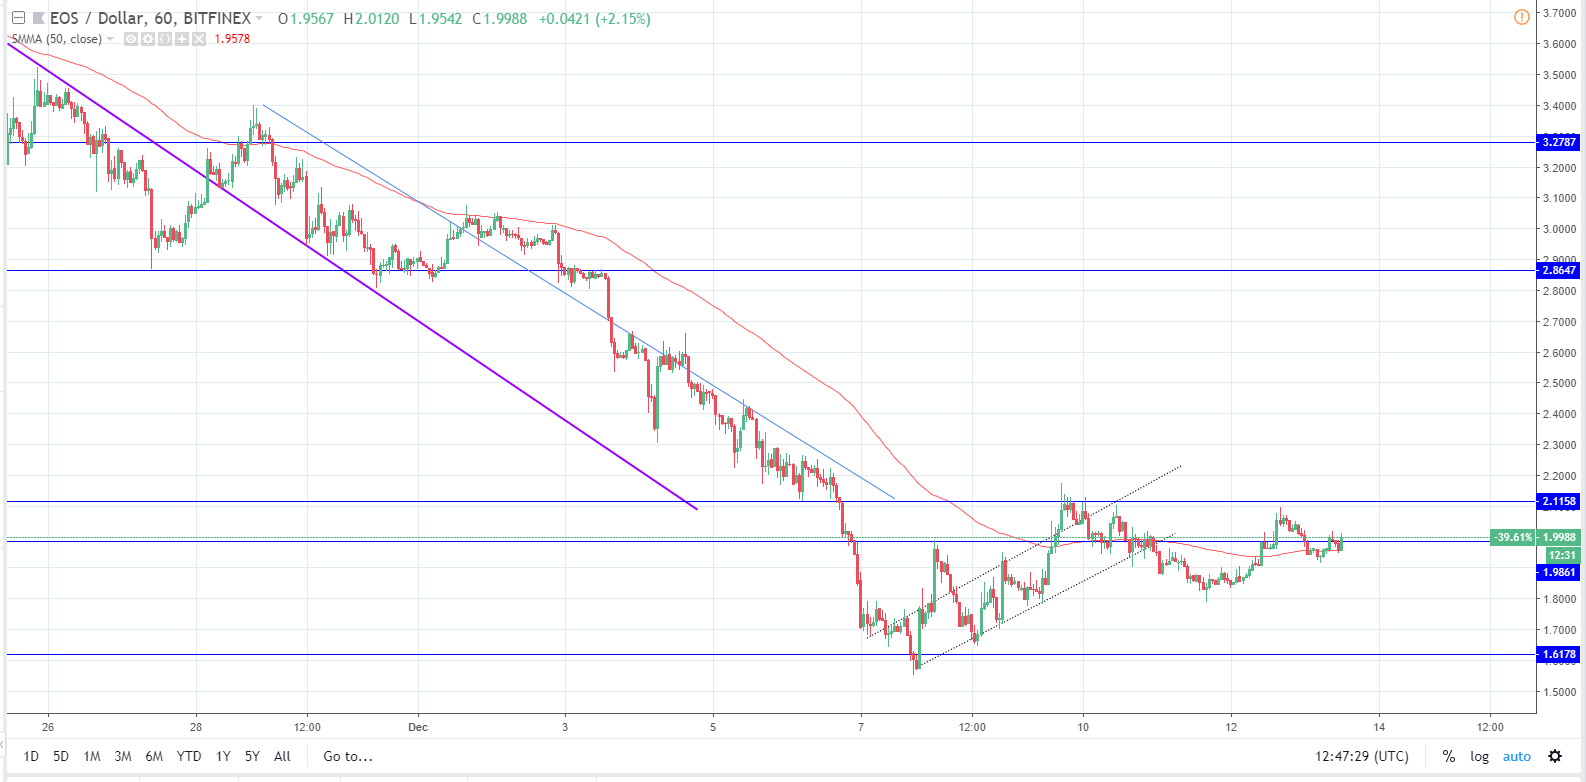
Looking at the hourly chart, you can see that the price has hit its lowest on Friday when the price was $1.5717 at its lowest point. Since then the price action has created an ascending channel, which led the price to recovery to about 33% as it came to $2.1158 level, which is the prior range support. The price got rejected there. Hence, it went in a downward trajectory and came down to establish a higher low at $1.8384.
From there the price went on to attempt another breakout from the upside. However it was stopped out again at the horizontal resistance level and is currently below the second less significant horizontal level and it is getting rejected there as well by the looks of the current candles.
For these reasons, we should expect more downside for the price of EOS and the first potential target would be at the prior low level at around $1.6. But considering the momentum behind the sell-off this support level the price might hold now and we see yearly lows for the price of EOS.
FXOpen offers the world's most popular cryptocurrency CFDs*, including Bitcoin and Ethereum. Floating spreads, 1:2 leverage — at your service (additional fees may apply). Open your trading account now or learn more about crypto CFD trading with FXOpen.
*Important: At FXOpen UK, Cryptocurrency trading via CFDs is only available to our Professional clients. They are not available for trading by Retail clients. To find out more information about how this may affect you, please get in touch with our team.
This article represents the opinion of the Companies operating under the FXOpen brand only. It is not to be construed as an offer, solicitation, or recommendation with respect to products and services provided by the Companies operating under the FXOpen brand, nor is it to be considered financial advice.
Stay ahead of the market!
Subscribe now to our mailing list and receive the latest market news and insights delivered directly to your inbox.


Latest articles

EUR/USD and GBP/USD consolidate ahead of the Fed decision
European currencies are showing subdued dynamics, entering a consolidation phase following their previous advance. Earlier, EUR/USD and GBP/USD broke out of their ranges and strengthened; however, the subsequent correction has led both pairs to retest the previously breached

Meta: V-Shaped Recovery Meets Heavy Volume Resistance
The movement in Meta Platforms shares is being driven by two competing narratives. On one hand, advertising revenue is benefiting from AI-based tools: the Advantage+ platform continues to support strong advertiser demand, and the analyst consensus for Q1 2026 revenue

Commodity Currencies Test Key Levels Ahead of Major Macro Data
Commodity-linked currencies are trading near key levels, showing restrained price action as market participants adopt a wait-and-see approach. The fundamental backdrop is shaped by expectations surrounding the release of Australia’s inflation data and the Bank of Canada’s interest