


LTC/USD and EOS/USD - more downside expected as the correction develops fully
FXOpen
LTC/USD
From last week when the price of Litecoin was sitting at $84.4 on Monday’s high, we have seen a decrease of 14.73% measured to yesterday’s low at around $71.9 which is the weekly low so far. The price has recovered slightly from yesterday’s downfall and reached $74.36 at its highest point today but again started decreasing and is currently sitting at around $73.
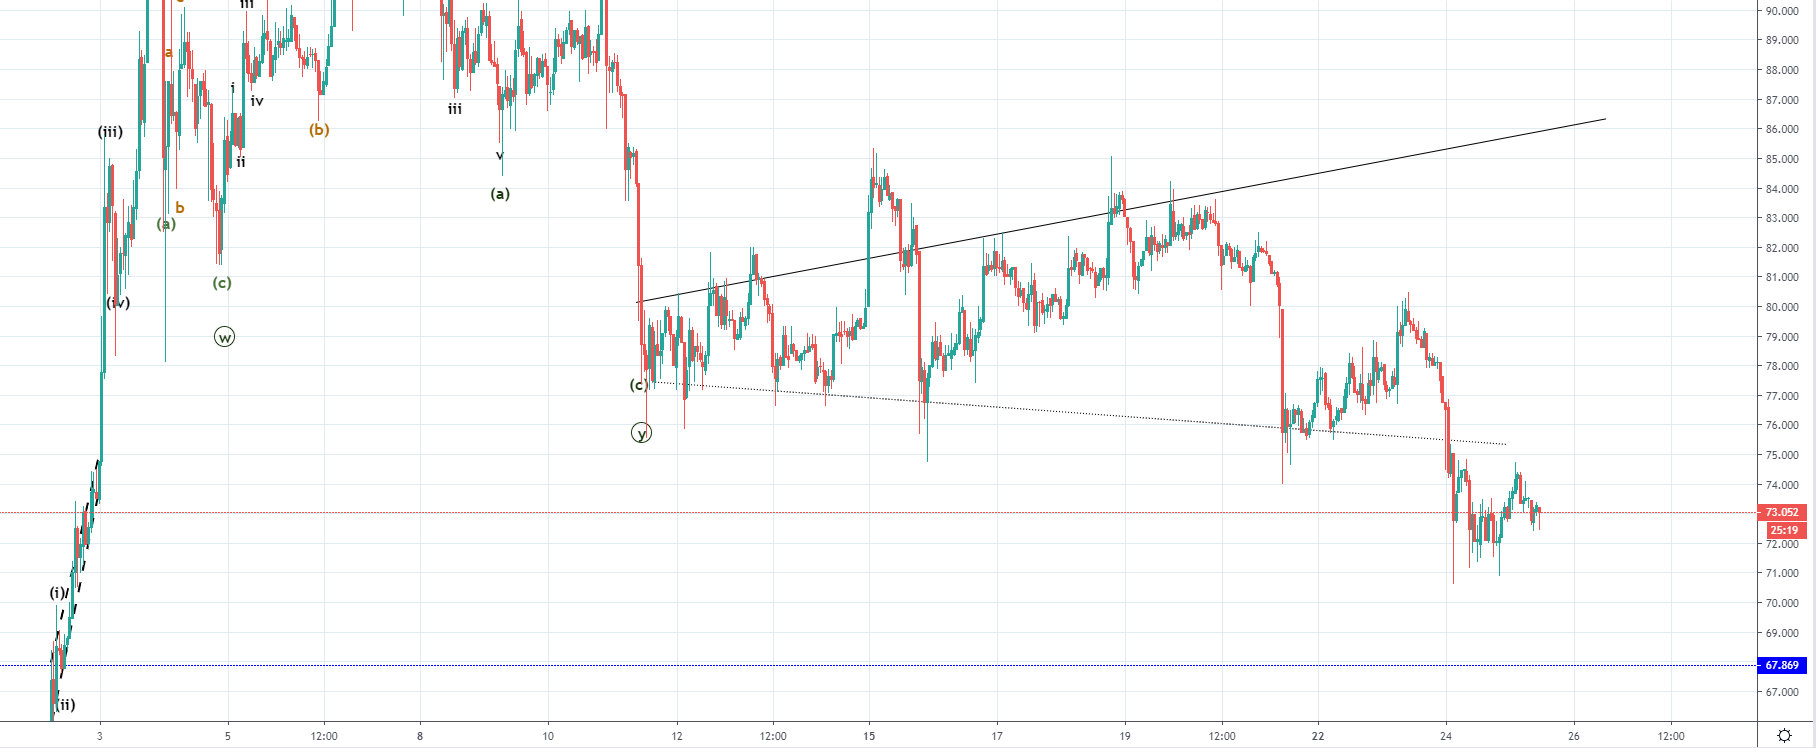
On the hourly chart, we can see that the price made a breakout to the downside from the expanding structure that was seen from the 12th of April and that with strong momentum. As previous to the formation of the expanding structure, I have counted a three-wave correction we are most likely seeing its continuation. The expanding structure looked like it could have been the start of the next impulsive move the upside but since a breakout to the downside occurred instead it was most likely the 4th wave out of the same correction.
If this is true, then we are seeing the beginning of the 5th wave Z from the extended count which means that now more downside should be expected as the final corrective wave develops fully. Since the price found some temporary support around $72 which isn’t a significant support level I would be expecting further downside movement below $70, potentially to $57 where the broken resistance is going to be retested for support.
EOS/USD
From last Monday’s high at $5.6268 the price of EOS has decreased by 17.22% measured to the weekly low which came in yesterday as the price came down to $4.6578. The price has recovered by 4.49% from there today and came up to $4.8616 but again another minor downfall was made with the price currently sitting at $4.733.
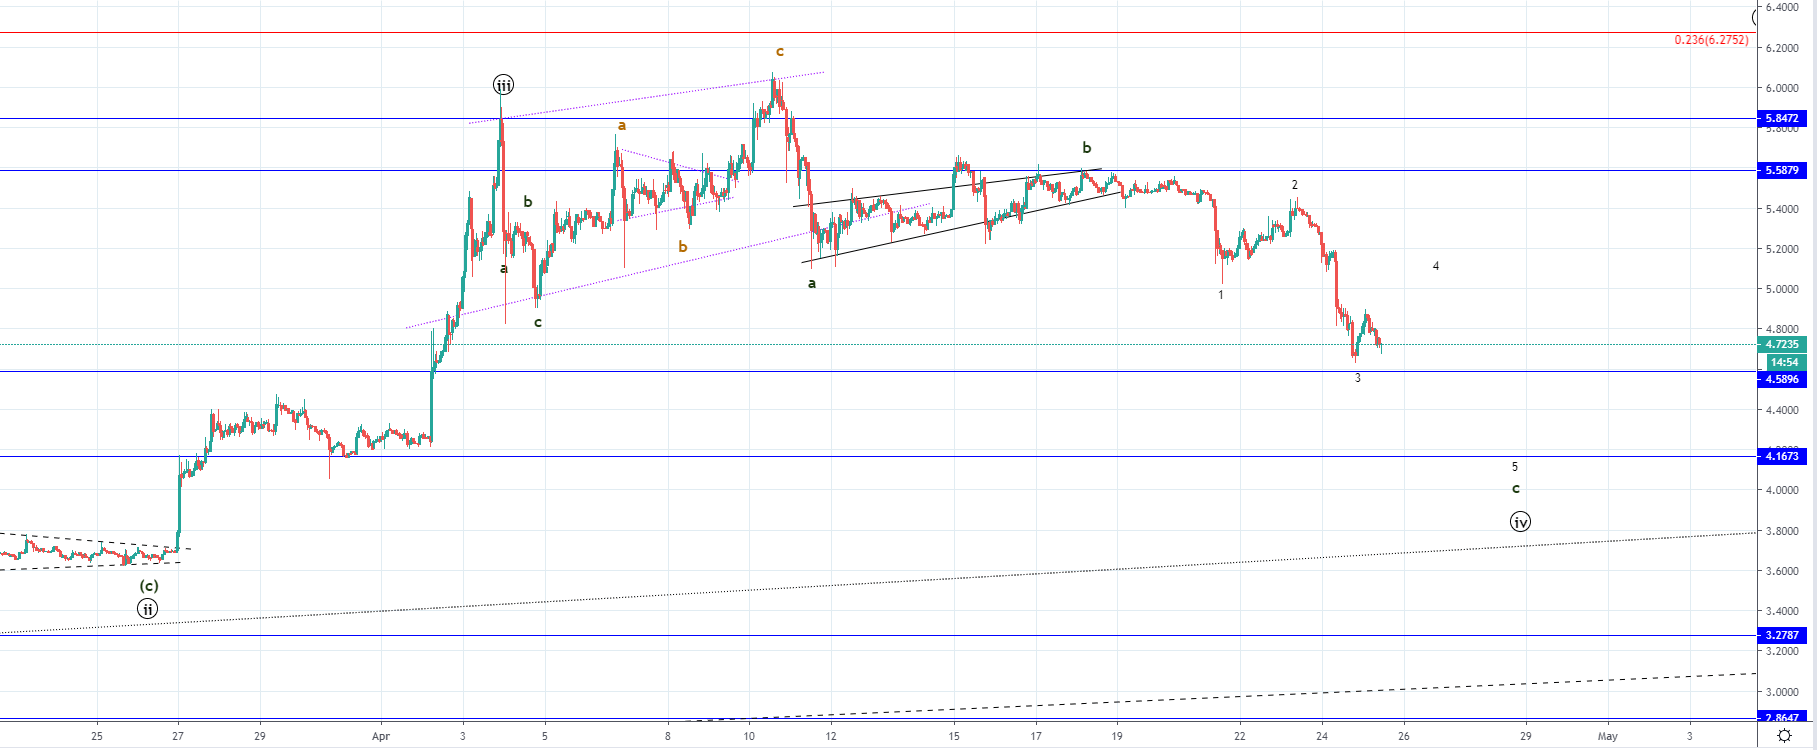
On the hourly chart, we can see that the price of EOS has fallen below its previous horizontal support level from the first Subminuette ABC correction around $4.95 and is currently in a downward trajectory. Some temporary support has been found but I don’t believe that this is the end of the currently seen downside movement since the C wave should develop in five waves and I have only counted three so far with the 4th one developing.
Now we are most likely going to see some upside movement which is set to retest the broken range before another lower low could be made on the 5th wave. This would be the completion of the third ABC correction which could be the end of a higher degree three-wave correction that is the 4th wave from the Minute impulse wave to the upside, which means that after it ends another and the final increase would be expected.
The price target for the expected ending point of the currently seen downside movement would be around $4.4-4.16 area in between horizontal levels from the previous minor correctional structure.
FXOpen offers the world's most popular cryptocurrency CFDs*, including Bitcoin and Ethereum. Floating spreads, 1:2 leverage — at your service (additional fees may apply). Open your trading account now or learn more about crypto CFD trading with FXOpen.
*Important: At FXOpen UK, Cryptocurrency trading via CFDs is only available to our Professional clients. They are not available for trading by Retail clients. To find out more information about how this may affect you, please get in touch with our team.
This article represents the opinion of the Companies operating under the FXOpen brand only. It is not to be construed as an offer, solicitation, or recommendation with respect to products and services provided by the Companies operating under the FXOpen brand, nor is it to be considered financial advice.
Stay ahead of the market!
Subscribe now to our mailing list and receive the latest market news and insights delivered directly to your inbox.


Latest articles

Apple: Earnings Day Above the Activity Zone
On 30 April, after the market close, Apple Inc. will release its financial results for the second quarter of fiscal 2026. The consensus forecast, based on estimates from 31 analysts, points to revenue of around $109.7 billion, with expected

USD/JPY and USD/CHF Near Key Levels: The Dollar Supported by the Fed
The US dollar continues to trend upwards following the Federal Reserve meeting, drawing support from the regulator’s moderately hawkish stance and comments by Jerome Powell. Markets interpret the Fed’s rhetoric as a signal that restrictive policy is likely

EUR/USD and GBP/USD consolidate ahead of the Fed decision
European currencies are showing subdued dynamics, entering a consolidation phase following their previous advance. Earlier, EUR/USD and GBP/USD broke out of their ranges and strengthened; however, the subsequent correction has led both pairs to retest the previously breached