


FXOpen
LTC/USD
From last Thursday when the price of Litecoin was $50.56 we have seen an increase at first as the bullish upswing continued to push the price higher until Sunday when the price of Litecoin came up to $54.881 at its highest point. From there the price started declining fast as it came down by just over 20% in a matter of hours on Monday as the price was around $43.5 at its lowest point.
Since Monday’s low, the price has been hovering sideways around $46 level and is currently sitting at $47 level and is in an upward trajectory.
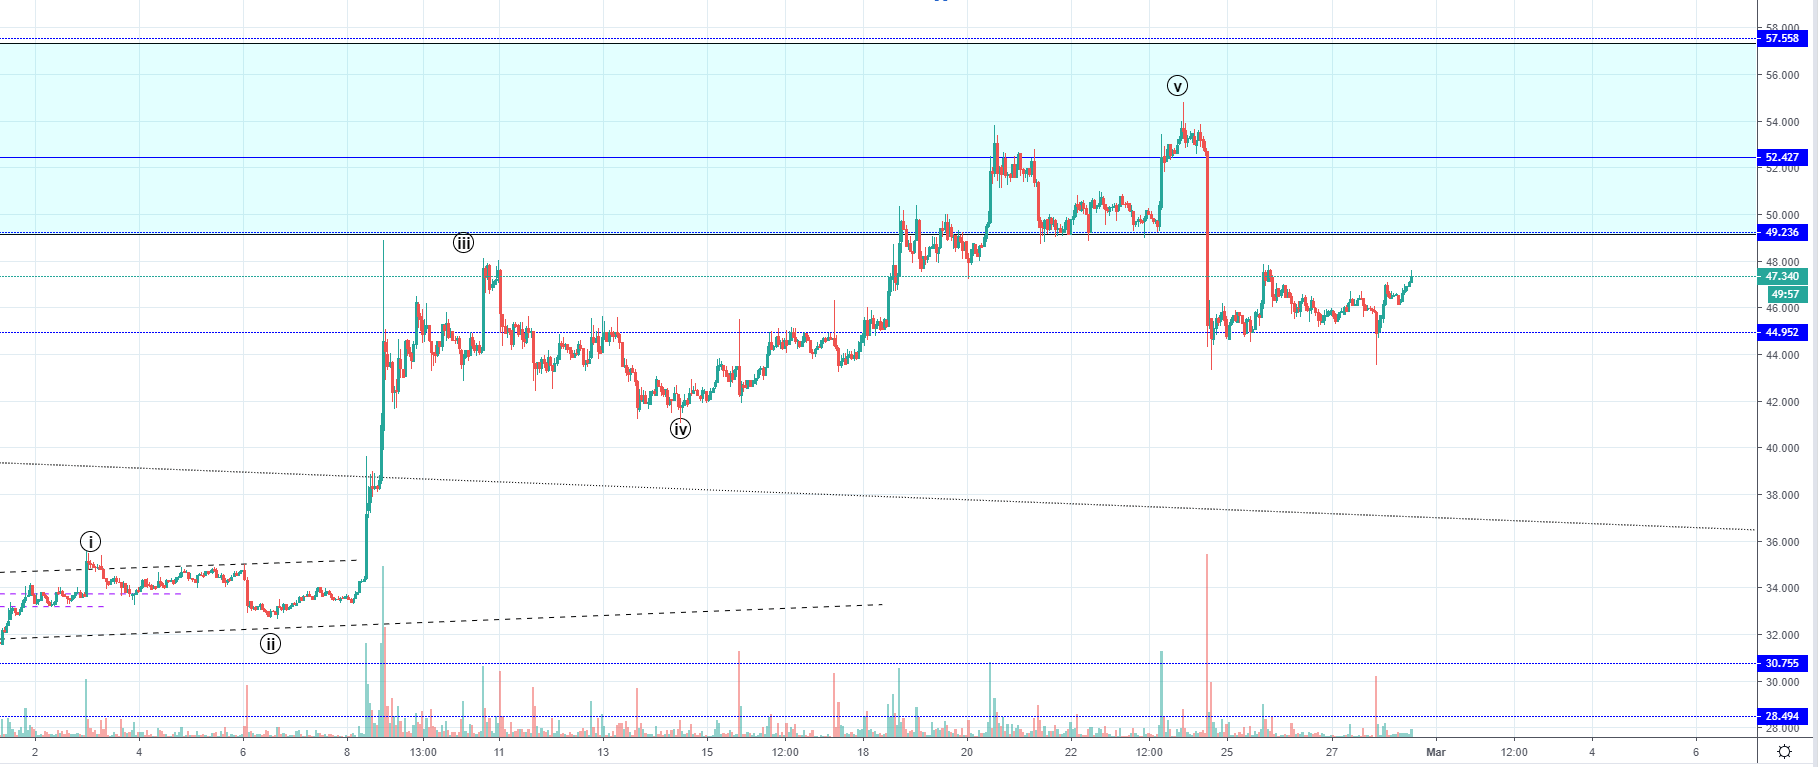
Looking at the hourly chart, you can see that the price action is stuck in a horizontal range between the current level and the horizontal support at $44.952 on which the price landed after the Sunday’s drop. Previously the price increased impulsively and as I have counted 5 waves out of the impulsive move that led the price inside a resistance zone and above its median line, we are now seeing the start of the corrective structure developing.
This current horizontal range would probably end as a wxy correction inside a channel. And as the price is currently developing the third wave the correction might be over today and we could see a breakout to the downside soon. If the correction gets prolonged we are to see more sideways movement before a decisive move. Coming close to the weekend the most optimal scenario would be a prolongation until Sunday and a breakout afterward.
If the price goes below the current horizontal support I would expect to see it get much lower than the current levels, potentially landing around $41 where the ending point of the 4th wave is. But that could only be the first stop before the further decrease.
EOS/USD
From last Thursday when the price of EOS was $3.992 the altcoin has continued its upward trajectory. It was much like in the case of other cryptos as the market is strongly correlated until Sunday when it came up to $4.463 at its highest point, which was an increase of 12.13%. On Sunday the price started falling down fast as it came to $3.4656 at its lowest point on Monday, which was a decrease of 22.5%.
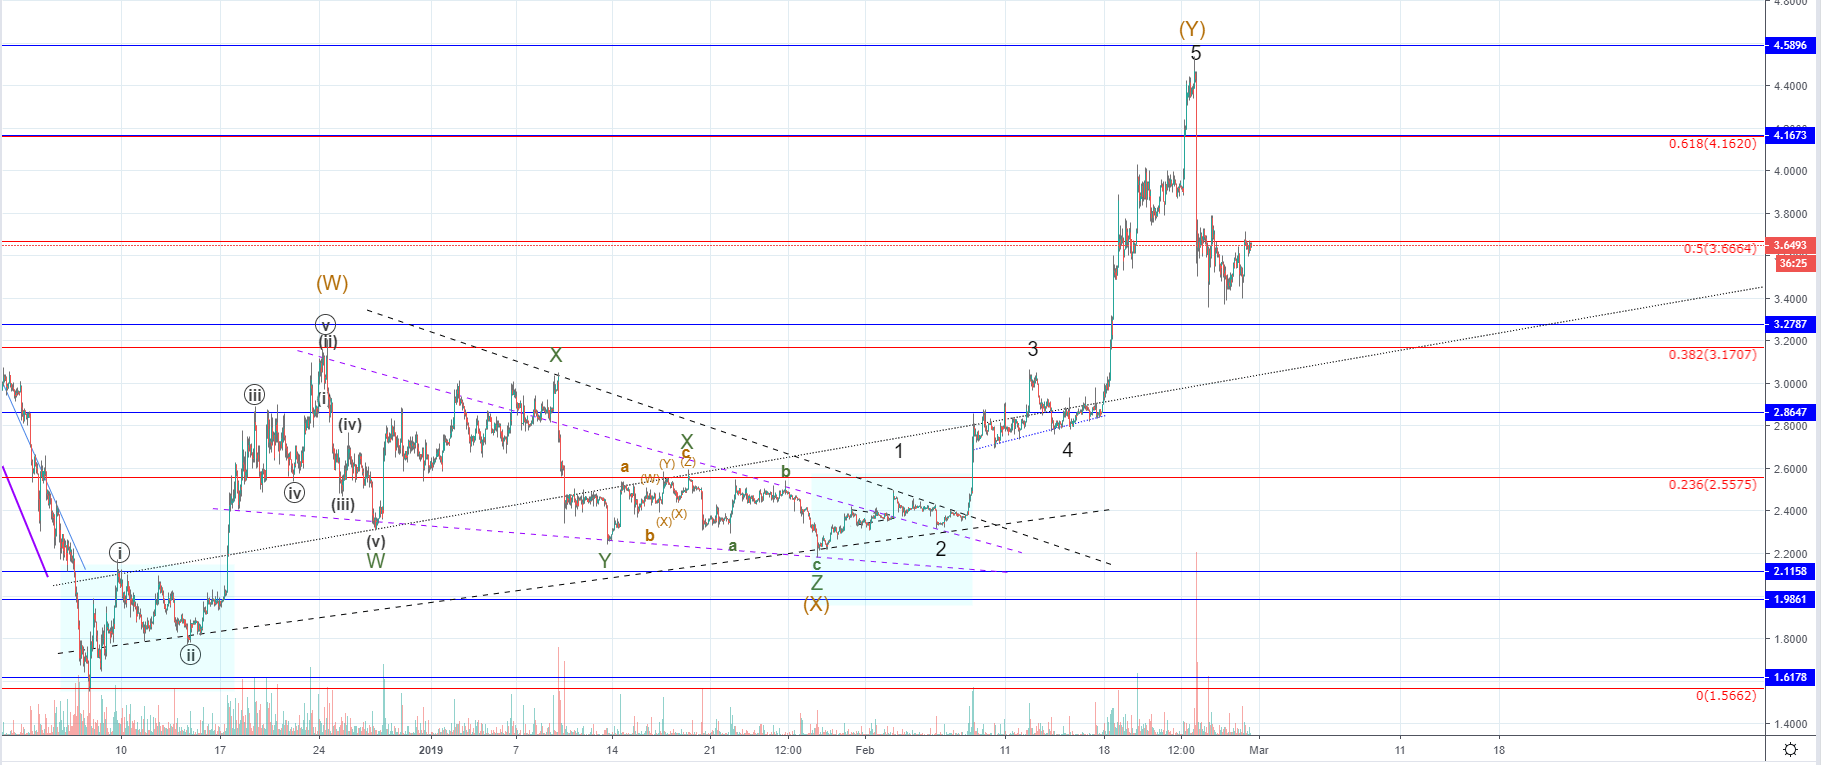
On the hourly chart, you can see that the 5 impulse wave to the upside has ended, so a retracement has expected to play out. The price came up to the horizontal support level. It now served as resistance at $4.5896 for an interaction which ended as a rejection, not because the level serves as strong resistance but because the price increased by over 104% from the start of the second impulse and the first minor resistance encountered triggered its end.
Currently, the price is interacting with the 0.5 Fibonacci level, retesting it for resistance from the downside. As it does serve as strong resistance I would be expecting a rejection soon which will propel the price further to the downside.
We might see some corrective increases which would in the case of EOS potentially be to the 0.618 Fibonacci level. But if this is true the corrective upswing shouldn’t exceed the Sunday’s high. In either way as the market has been in a bullish period which ended on Sunday, we are to see further correctional movements before another impulsive move is to develop.
FXOpen offers the world's most popular cryptocurrency CFDs*, including Bitcoin and Ethereum. Floating spreads, 1:2 leverage — at your service. Open your trading account now or learn more about crypto CFD trading with FXOpen.
*At FXOpen UK and FXOpen AU, Cryptocurrency CFDs are only available for trading by those clients categorised as Professional clients under FCA Rules and Professional clients under ASIC Rules respectively. They are not available for trading by Retail clients.
This article represents the opinion of the Companies operating under the FXOpen brand only. It is not to be construed as an offer, solicitation, or recommendation with respect to products and services provided by the Companies operating under the FXOpen brand, nor is it to be considered financial advice.
Stay ahead of the market!
Subscribe now to our mailing list and receive the latest market news and insights delivered directly to your inbox.

Latest articles

Weekly Market Wrap With Gary Thomson: Nasdaq, EUR/USD, USD/CHF, Brent Crude Oil, Googl Shares
Get the latest scoop on the week's hottest headlines, all in one convenient video. Join Gary Thomson, the COO of FXOpen UK, as he breaks down the most significant news reports and shares his expert insights.
- Nasdaq Composite: Worst Session

Analysis of AUD/USD: Exchange Rate Falls to Early May Low
As indicated by the 4-hour AUD/USD chart today:
→ the rate fell below 0.652, a level last seen on May 2;
→ the RSI indicator dropped below 15, a level last seen during the panic over the spread of COVID-19

Analysis of AMZN Stock: Price at 1.5-Month Low
As shown in the AMZN chart, the stock price dropped below:
→ the psychological level of $180;
→ the mid-June interim low.
The last time AMZN traded below $180 was in early June.
Thus, AMZN has faced sell-offs, similar to other tech