


LTC/USD and EOS/USD moving sideways
FXOpen
LTC/USD
From yesterday when Litecoin was at $81.894 the price hasn’t changed much as its currently being traded at around $81.
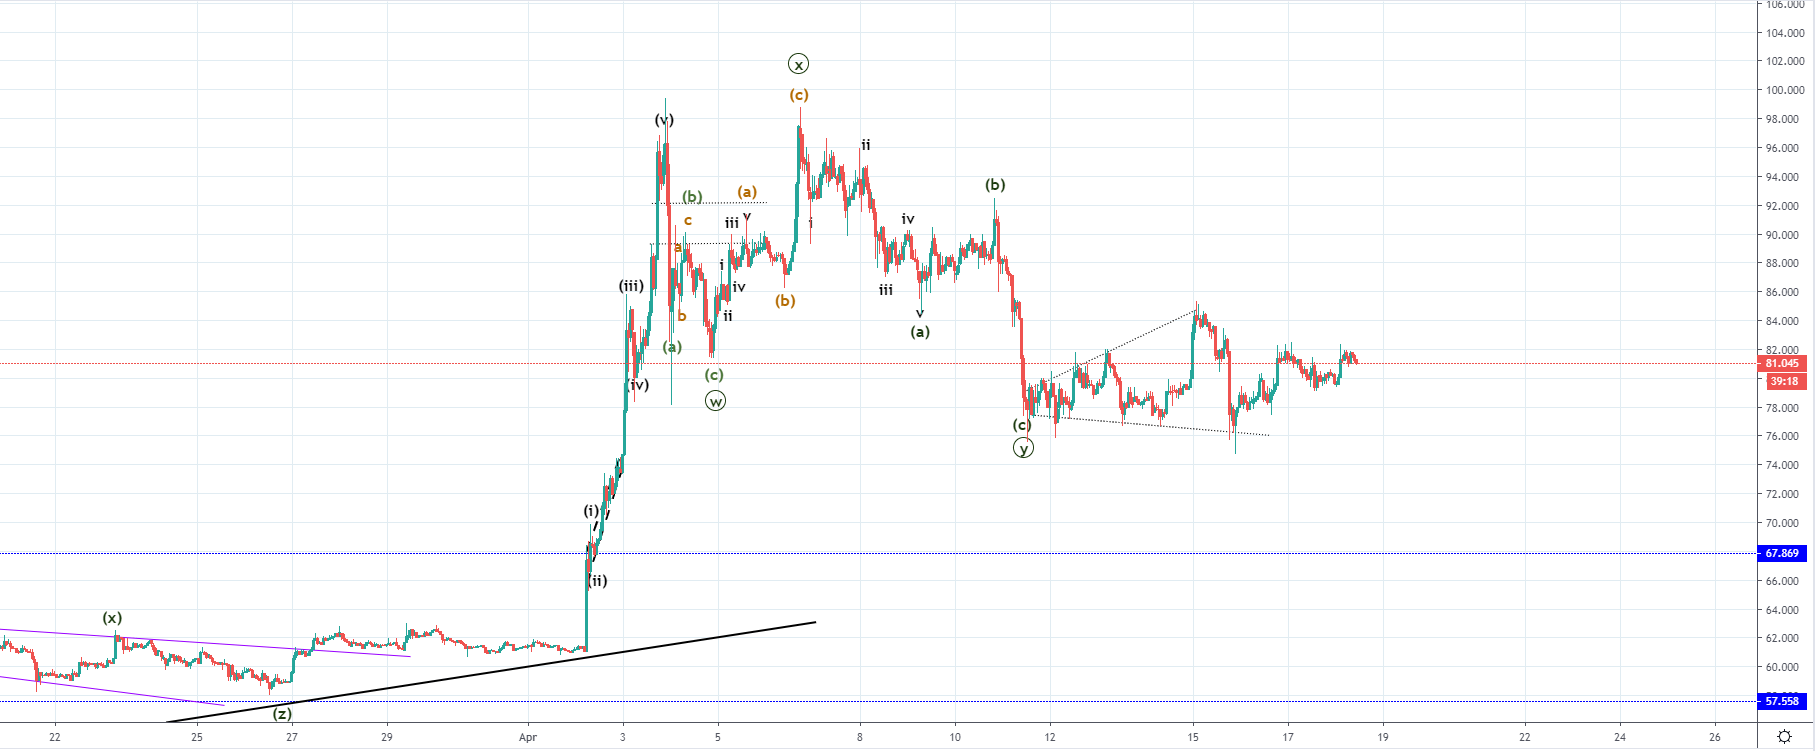
On the hourly chart, you can see that the price of Litecoin has been moving sideways from the 12th of April when a decrease with strong momentum has been made. As the price previously ended its impulsive move to the upside, a correction started developing out of which we have seen three waves. This means that I could have ended with the current structure being a consolidative range before finally the next move to the upside would start.
As you can see, the current structure is an expanding one with higher highs and lower lows. But since Monday when an interaction has been made with the support level, the price has been in an upward trajectory but still hasn’t come above the prior high level before encountering significant resistance.
This is why we are soon to see if the structure would be a continuation of the correction started on 3rd of April as now we are most likely going to see a move to the downside. It could lead the price for a breakout to the downside. But if the price finds support above the prior low at $76.65 horizontal support level and starts increasing again a breakout to the upside would be expected.
EOS/USD
From yesterday’s level of $5.5613 the price of EOS has fallen by 2.67% on yesterday’s low but then started increasing again and managed to pull back up to the levels from which the decrease was made. It is currently sitting around $5.515.
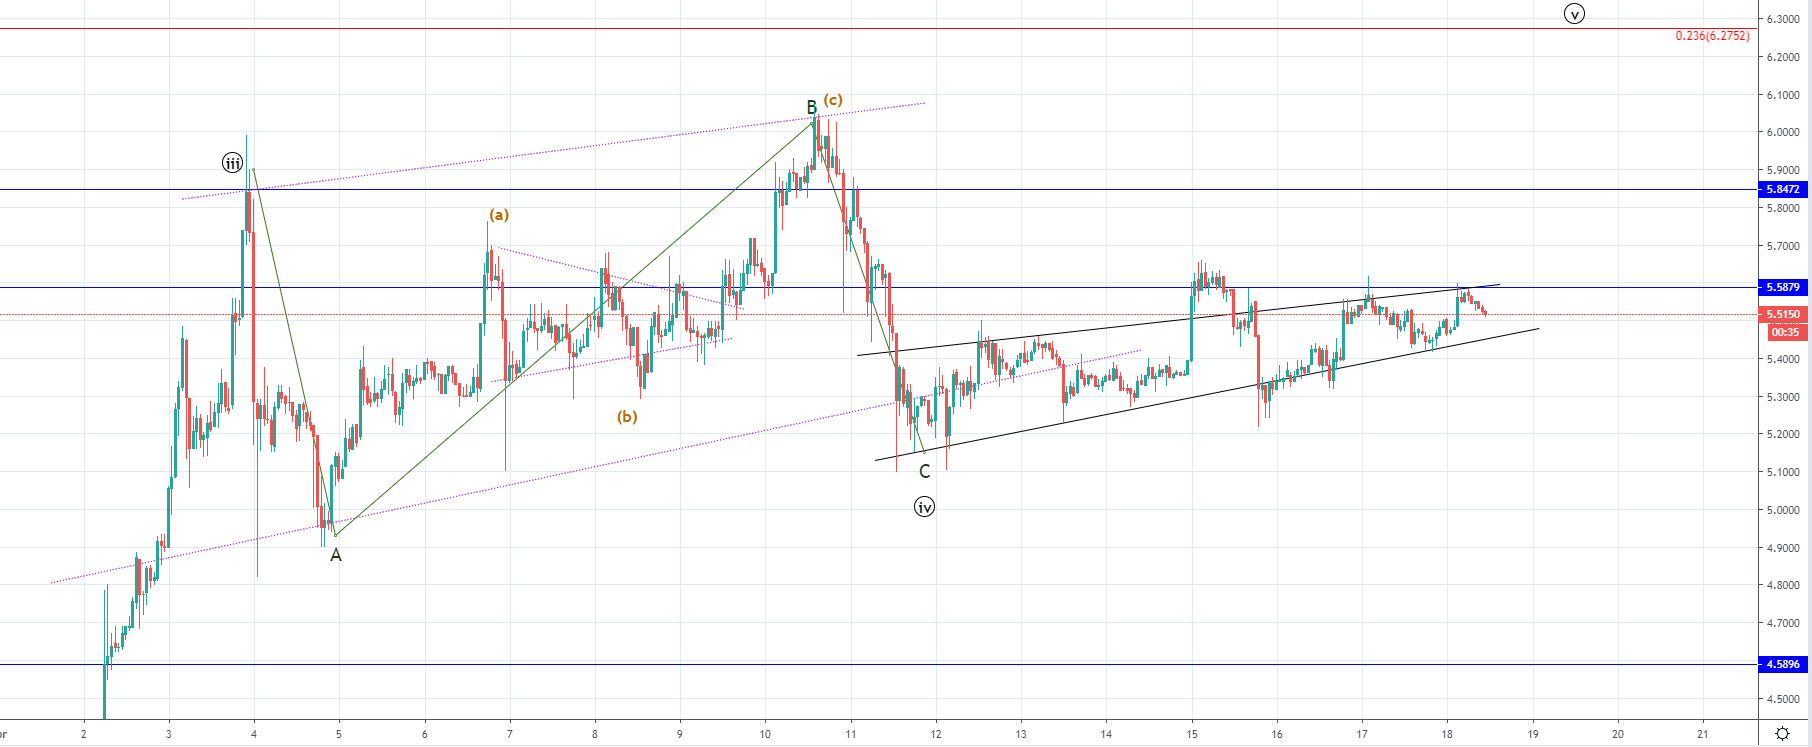
On the hourly chart, you can see a similar chart pattern like that one on the Litecoin’s chart in a sense that a three-wave correction took place before the current structure which is in the case of EOS an ascending one. As prior to the formation of the current ascending structure, a strong move to the downside was made in which the price of EOS decreased by over 14%, the ascending structure could be the part of the same correction and has served as a retest of the broken support at around $5.58 which got retested today again.
The retest ended as another third rejection which could be the final one before we see a breakout to the downside and a continuation of the mentioned three-wave correction. But it could also be some consolidative price action before the 5th wave impulse to the upside starts. This is why the significant pivot point would be at the mentioned horizontal resistance level at around $5.58. And if the price manages to come above it the bullish scenario would be in play.
If the price starts decreasing now after another encounter with the horizontal resistance and goes below the currently seen ascending support line a bearish scenario would be in play as we are in that case most likely seeing the continuation of the correctional structure that started on 3rd of April.
FXOpen offers the world's most popular cryptocurrency CFDs*, including Bitcoin and Ethereum. Floating spreads, 1:2 leverage — at your service (additional fees may apply). Open your trading account now or learn more about crypto CFD trading with FXOpen.
*Important: At FXOpen UK, Cryptocurrency trading via CFDs is only available to our Professional clients. They are not available for trading by Retail clients. To find out more information about how this may affect you, please get in touch with our team.
This article represents the opinion of the Companies operating under the FXOpen brand only. It is not to be construed as an offer, solicitation, or recommendation with respect to products and services provided by the Companies operating under the FXOpen brand, nor is it to be considered financial advice.
Stay ahead of the market!
Subscribe now to our mailing list and receive the latest market news and insights delivered directly to your inbox.


Latest articles

EUR/USD Eyes Gains As USD/CHF Weakness Deepens Again
EUR/USD started a fresh increase above 1.1700 and 1.1720. USD/CHF declined further and is now struggling below 0.7835.
Important Takeaways for EUR/USD and USD/CHF Analysis Today
· The Euro started a decent increase from

Apple: Earnings Day Above the Activity Zone
On 30 April, after the market close, Apple Inc. will release its financial results for the second quarter of fiscal 2026. The consensus forecast, based on estimates from 31 analysts, points to revenue of around $109.7 billion, with expected

USD/JPY and USD/CHF Near Key Levels: The Dollar Supported by the Fed
The US dollar continues to trend upwards following the Federal Reserve meeting, drawing support from the regulator’s moderately hawkish stance and comments by Jerome Powell. Markets interpret the Fed’s rhetoric as a signal that restrictive policy is likely