


LTC/USD and EOS/USD - retracement expected
FXOpen
LTC/USD
From last Thursday when the price of Litecoin was $51.54 at its lowest point, we have seen an increase of 27.78% measured to yesterday’s highest point of $53.511.
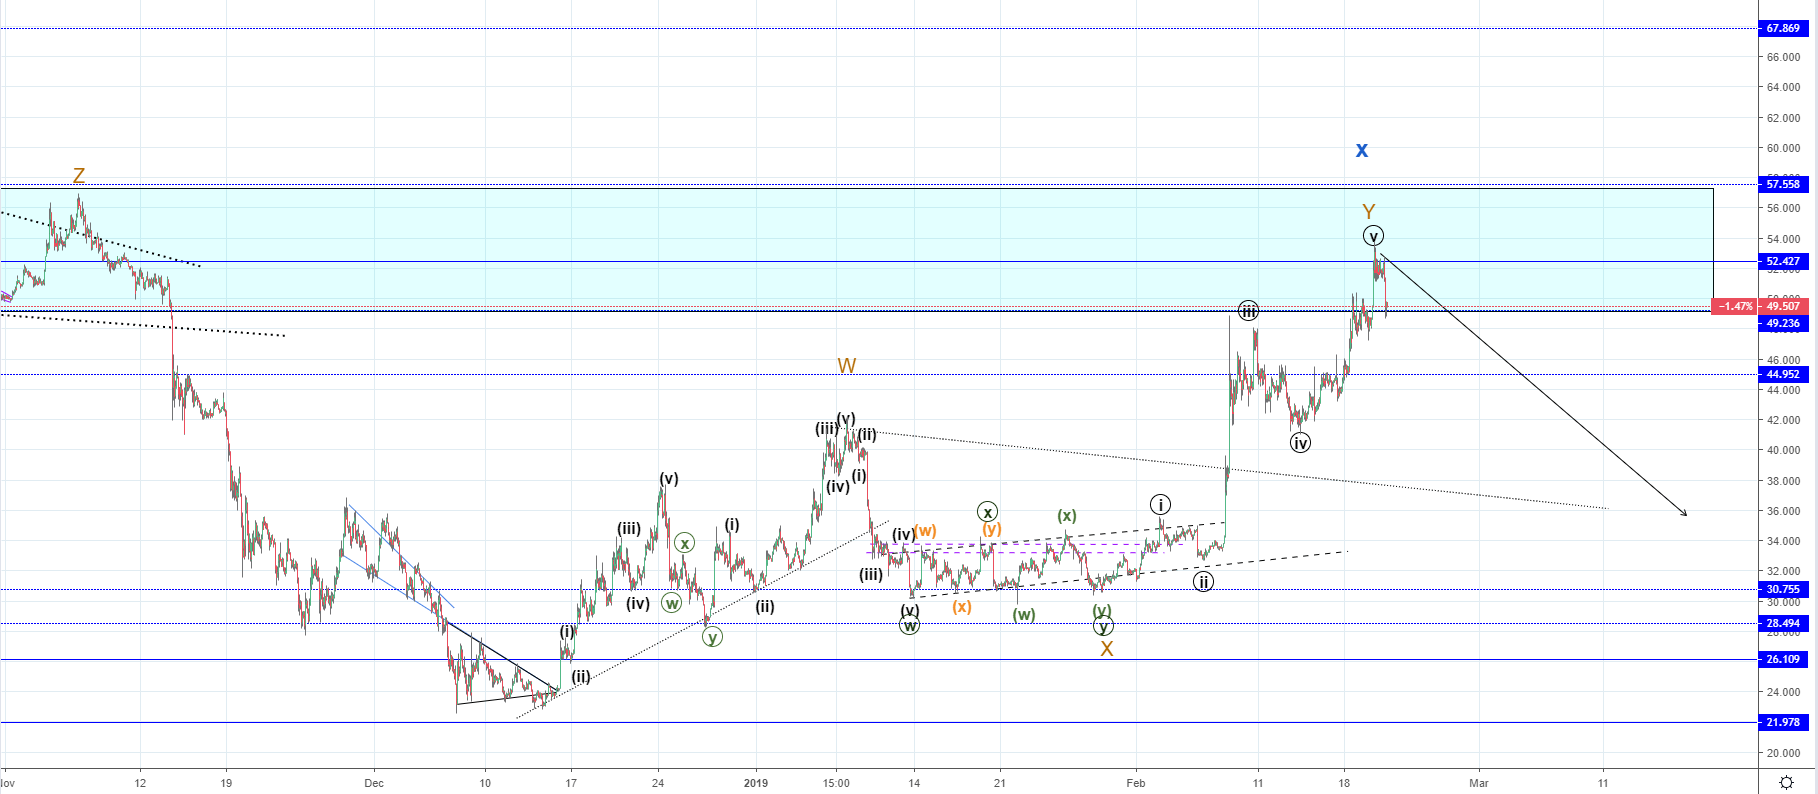
Looking at the hourly chart, you can see that the price of Litecoin has met my target as the 5th wave fully developed. It came up to the horizontal support zone’s median line and is now serving as strong resistance. The horizontal range has been entered, but since the interaction with the median line yesterday, the price has quickly started falling and came down by 6.76% in a matter of hours, indicating that the price has indeed entered the sellers’ territory.
Considering the fact that I have counted the end of the impulsive move and that the price has come inside the resistance range, we are likely to see a retracement now. For now the entire structure has been labeled as a Minor WXY correction and if it ended on the Y wave we are now going to see a continuation. So new lows could be expected for the price of Litecoin, as this was only a minor recovery.
The recovery might not have ended as we could see a prolongation with two more waves, but in either way when it ends, I would be expecting new lows. Currently, the price has found support on the horizontal range lower level. So if the support isn’t there we could see a breakout to the downside today.
EOS/USD
From last week’s analysis when the price of EOS was $2.75 at its lowest point we have seen an increase of 45% measured to the highest level so far, which was yesterday at around $4.
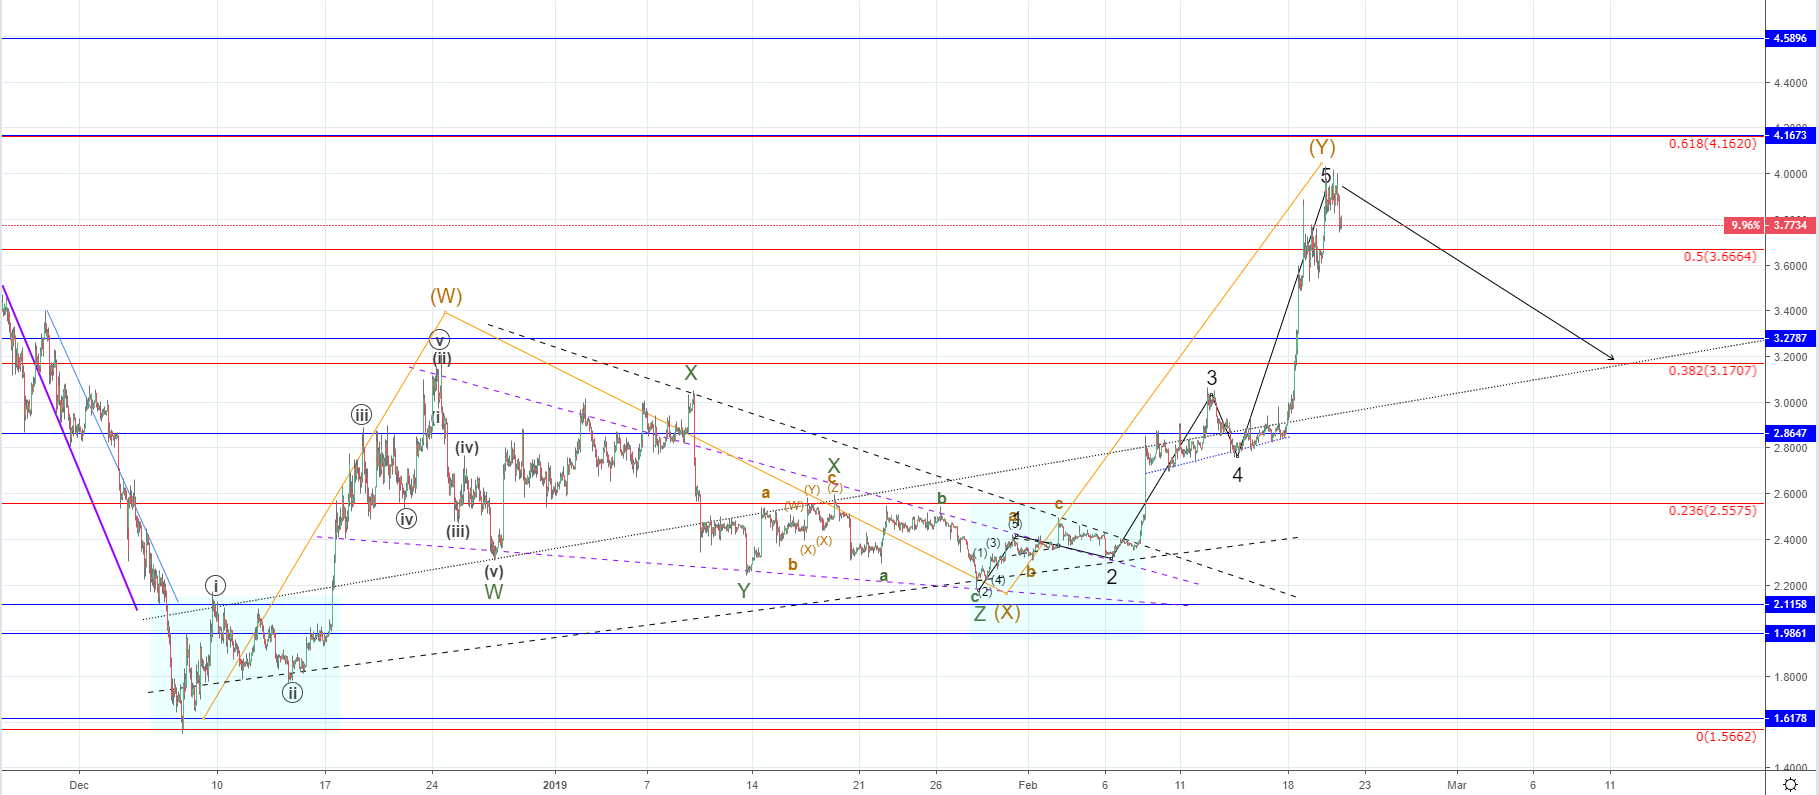
Looking at the hourly chart, you can see that the wave structure looks similar to that of Litecoin as the 5th wave to the upside was most likely ended and with it the Intermediate Y wave out of the WXY correction. Now a retracement should be expected as the price increased by 151.8% in total from the start of the correction when the price of EOS was $1.57 at its lowest point.
The downside move that is now expected could be either a prolongation of the mentioned correction. In this case we are going to see another increase before it ends as the Z wave should develop to the upside or the correction ended. That is why now we are going to see a continuation.
The 0.382 Fibonacci level would be the first significant support line so if it holds we could be seeing the second X wave. But if the price manages to go below it the most likely scenario is that the correction ended and that further lows would develop.
FXOpen offers the world's most popular cryptocurrency CFDs*, including Bitcoin and Ethereum. Floating spreads, 1:2 leverage — at your service (additional fees may apply). Open your trading account now or learn more about crypto CFD trading with FXOpen.
*Important: At FXOpen UK, Cryptocurrency trading via CFDs is only available to our Professional clients. They are not available for trading by Retail clients. To find out more information about how this may affect you, please get in touch with our team.
This article represents the opinion of the Companies operating under the FXOpen brand only. It is not to be construed as an offer, solicitation, or recommendation with respect to products and services provided by the Companies operating under the FXOpen brand, nor is it to be considered financial advice.
Stay ahead of the market!
Subscribe now to our mailing list and receive the latest market news and insights delivered directly to your inbox.


Latest articles

DAX 40: consolidation amid technology sell-off
A wave of selling in the technology sector that emerged earlier this week has weighed on European equities. The trigger was investor concern over the profitability of large-scale debt-funded investments by major US tech companies in AI infrastructure. The Nasdaq

Euro Hits Fresh Yearly Lows Amid Dovish ECB Signals
The euro remains under pressure following weak macroeconomic data from the euro area and fresh signals that the European Central Bank is prepared to maintain a more accommodative monetary policy stance. Data released yesterday pointed to a deterioration in business

Pound at Key Levels: Markets Assess Impact of Political Uncertainty in the UK
The British pound remains under pressure following increased political uncertainty in the United Kingdom triggered by the Prime Minister’s resignation. Investors are assessing potential shifts in the political and economic policy outlook after the head of government stepped down,