


FXOpen
LTC/USD
From yesterday’s open at $34.755 the price of Litecoin has started plummeting down, falling by 5.66% to its lowest point yesterday at $32.774. Since then, the price has gained some upward traction and is currently sitting at around $34 – slightly below yesterday’s price.
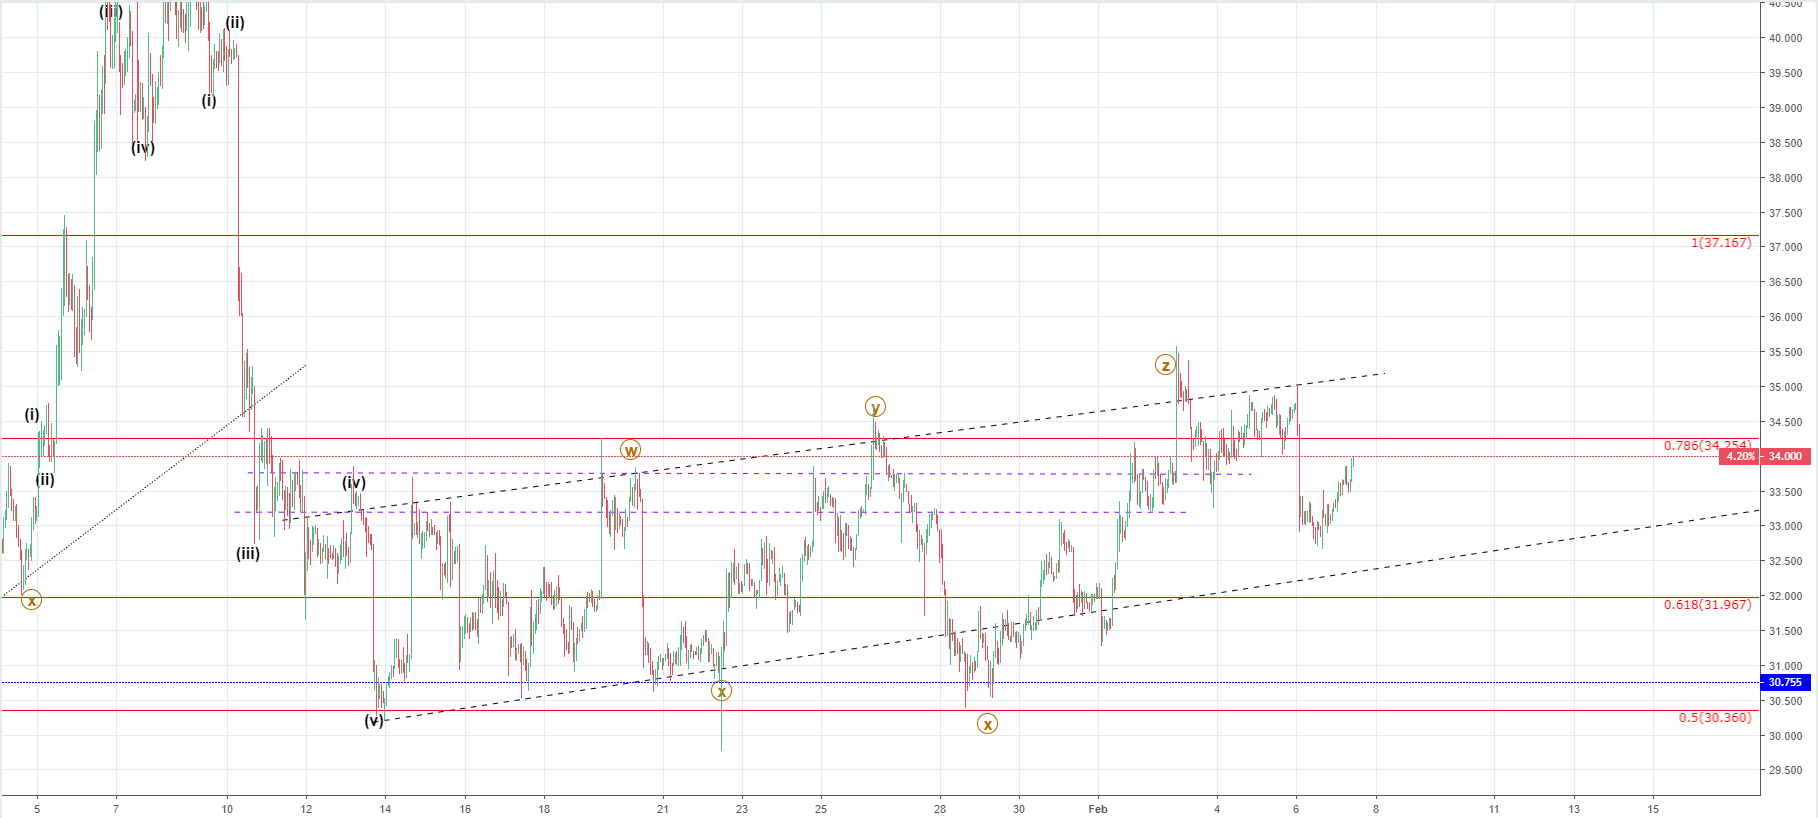
Looking at the hourly chart, you can see that yesterday’s open was the interaction with the ascending channel’s resistance line resulted in a rejection pushing the price strongly below the 0.786 Fibonacci retracement level and below the horizontal resistance zone (interrupted purple lines), which were serving as support on the way up above the 0.786.
Currently, the price is in an upward trajectory and again above the resistance zone but is below the 0.786 Fibonacci level. Previously to the formation of the ascending channel, we have seen an impulsive move to the downside. Hence, the structure inside the channel is corrective in nature and was labeled as a Minute WXYXZ correction. The correction appears to be over and if this is true then the movement that was seen from 3rd of February is the start of another impulsive move to the downside. It has 4 waves buy now so I would be expecting the last one, which would end on the ascending channels support at least.
Ultimately the expected impulse wave to the downside is expected to break out from the current range and continue the downward movement after some period of consolidation. The target would be lower than the 0.5 Fibonacci level but we are yet to see the momentum behind the move in order to project the possible ending point.
EOS/USD
From yesterday’s open at $2.42 the price of EOS has fallen steeply and aggressively as the price of Litecoin, but only by 3.59% as it came to $2.3348 at its lowest point.
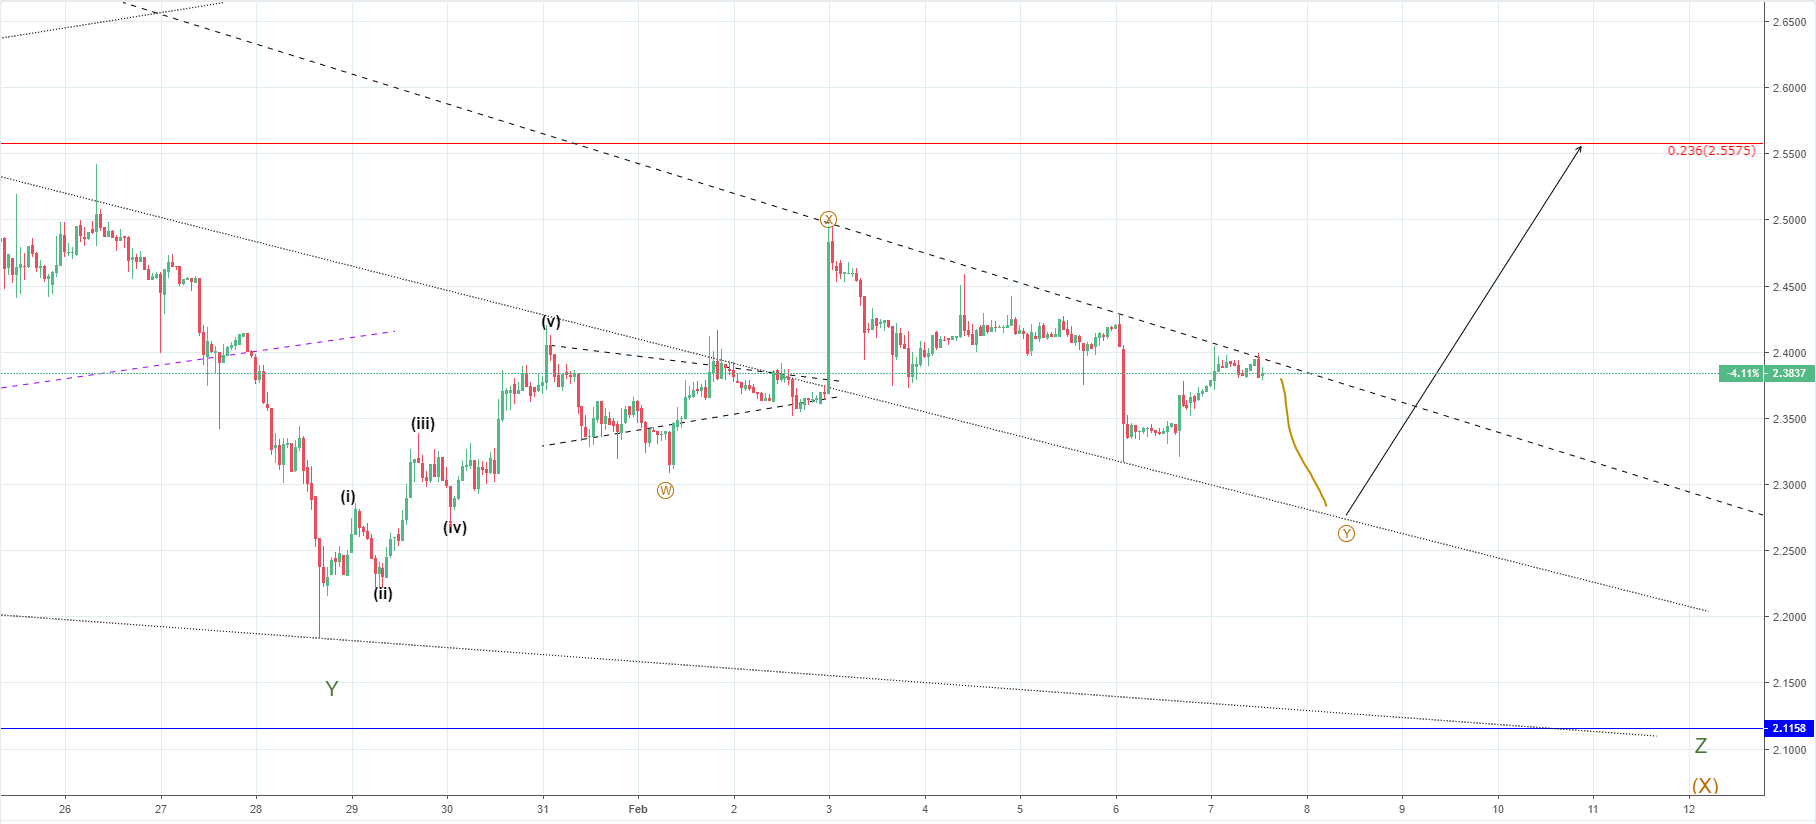
Looking at the hourly chart, you can see that the price has broken out from the falling wedge on 3rd when an increase was made impulsively to the downside and reached the upper resistance level from the falling wedge, which had only one point of interaction with the first wave X from the Minor WXYXZ correction. The price is currently getting rejected at the resistance levels, so I would be expecting it to go back to the falling wedge support level for interaction and an attempt to establish support.
If the support is there then another increase to the upside potential to $2.5575 would be expected where the 0.236 Fibonacci level, but if it is I would be expecting it to go down from there as it is in the final stage of the Minor correction and there is one more low before it ends, according to my Elliott Wave count.
FXOpen offers the world's most popular cryptocurrency CFDs*, including Bitcoin and Ethereum. Floating spreads, 1:2 leverage — at your service (additional fees may apply). Open your trading account now or learn more about crypto CFD trading with FXOpen.
*Important: At FXOpen UK, Cryptocurrency trading via CFDs is only available to our Professional clients. They are not available for trading by Retail clients. To find out more information about how this may affect you, please get in touch with our team.
This article represents the opinion of the Companies operating under the FXOpen brand only. It is not to be construed as an offer, solicitation, or recommendation with respect to products and services provided by the Companies operating under the FXOpen brand, nor is it to be considered financial advice.
Stay ahead of the market!
Subscribe now to our mailing list and receive the latest market news and insights delivered directly to your inbox.


Latest articles

Market Insights with Gary Thomson: Where Are Oil, Gas & Global Indices Heading?
In this video, we’ll explore the key economic events and market trends, shaping the financial landscape. Get ready for insights into financial markets to help you navigate the week ahead. Let’s dive in!
In this episode of Market

Netflix (NFLX) Shares Pull Back After a 30% Surge
On 21 January, while analysing the NFLX chart, we:
→ identified a descending channel and a resistance zone around the $100 level;
→ noted that Netflix shares were showing a sustained downtrend. Selling pressure had been triggered primarily by reports of a

US Dollar Index (DXY) Rises Above the 100 Level
Today the US Dollar Index (DXY) climbed above the psychological 100 mark for the first time in 2026, supported by a tense fundamental backdrop, with the military conflict in the Middle East acting as the main driver.
→ Financial market participants