


More Losses for Ether, Dash Apr 2018
FXOpen
Both Ether and Dash saw new lows this week, with prices bottoming out at 0.05240 BTC and 0.04077 BTC respectively. Since these lows we’re seeing somewhat of a bounce for both altcoins but more on that later.
Ether Downtrend Still in Force
The downtrend for ETH/BTC continues for another week. Right now the crypto is trading at 0.05430 per BTC, around 4 percent off the lows.
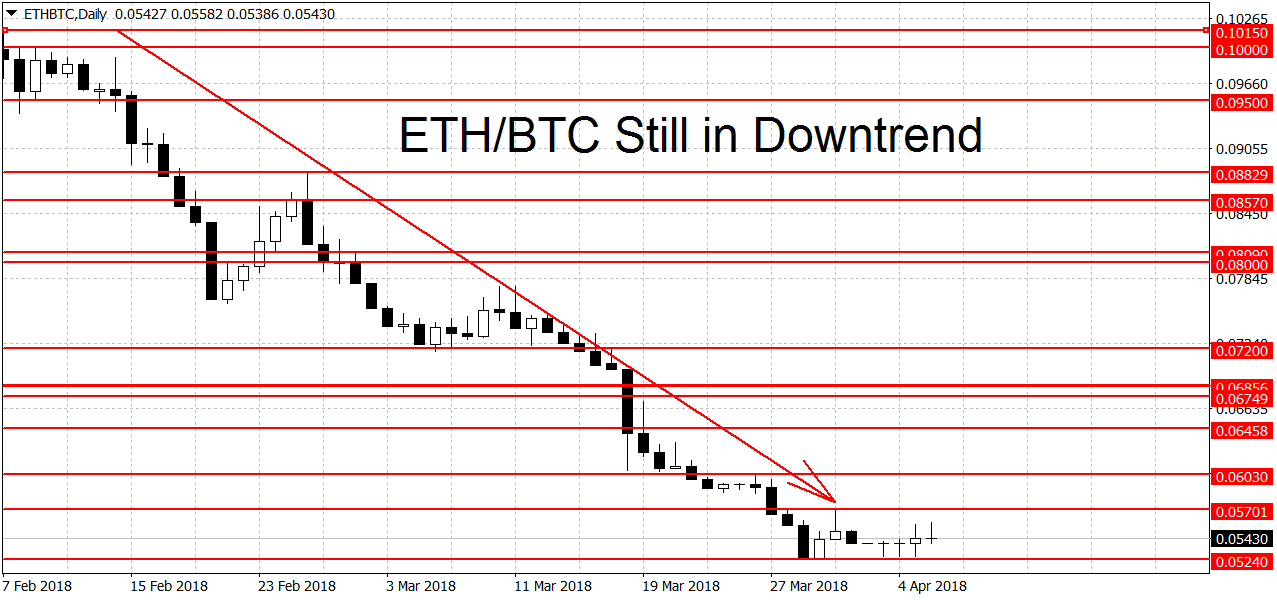
We’ve been mostly range-bound during the past few days but we’re still far from ending the bearish trend on the daily charts. For that to happen the bulls need to push us above the 0.06030 BTC swing high. Higher up a break above 0.072 BTC is needed to trigger a new uptrend.
Below current prices there’s major support in the 0.050 – 0.052 BTC area. A decisive break below the 0.05 round figure would exacerbate the losses for Ether. On the longer-term charts ETH/BTC is looking range-bound on the weeklies but bullish on the monthly charts.
Dash Drops Lower
Dash hit a new multi-month low this week, with prices bottoming out at 0.04077 BTC before a small recovery rally. We are currently quoted at 0.04318 BTC, up by almost 6 percent from the lows.
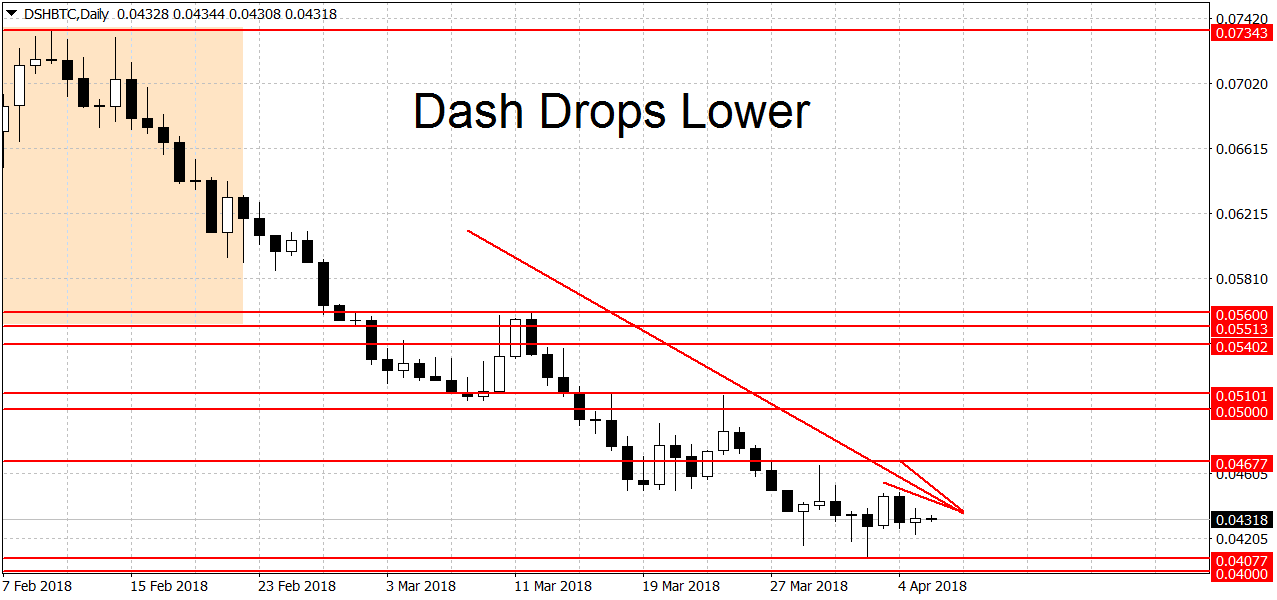
But the trend lower is not over yet, for that we need a breakout above 0.04677 BTC. A move beyond the 0.05101 BTC swing high is needed for a new rally. Slightly below here the 0.05 BTC round figure should also act as resistance to rising prices.
Below we’re looking at support around the 0.04 BTC round figure. A clean break below here could open the door toward the next two potential support levels at the 0.03557 and 0.03452 BTC swing lows. On the weekly charts DSH/BTC is range-bound. The monthly charts are still exhibiting a bullish bias.
Bitcoin Loses Ground
The short dead cat bounce in BTC/USD seems to be over. After a gain from $6,420 to $7,499 in three days prices took a nosedive yesterday, hitting a low of $6,715 dollars per coin. Today the move lower continued with a low of $6,561, almost completely retracing the previous up move.
Bitcoin is trading at $6,801 dollars right now but price action suggest more losses could be on the way. The trend on the daily charts is still down as well. To end it we need a breakout above $8,256 dollars. A new BTC rally could commence with a break above the $9,165 swing high.
FXOpen offers the world's most popular cryptocurrency CFDs*, including Bitcoin and Ethereum. Floating spreads, 1:2 leverage — at your service (additional fees may apply). Open your trading account now or learn more about crypto CFD trading with FXOpen.
*Important: At FXOpen UK, Cryptocurrency trading via CFDs is only available to our Professional clients. They are not available for trading by Retail clients. To find out more information about how this may affect you, please get in touch with our team.
This article represents the opinion of the Companies operating under the FXOpen brand only. It is not to be construed as an offer, solicitation, or recommendation with respect to products and services provided by the Companies operating under the FXOpen brand, nor is it to be considered financial advice.
Stay ahead of the market!
Subscribe now to our mailing list and receive the latest market news and insights delivered directly to your inbox.


Latest articles

Apple: Earnings Day Above the Activity Zone
On 30 April, after the market close, Apple Inc. will release its financial results for the second quarter of fiscal 2026. The consensus forecast, based on estimates from 31 analysts, points to revenue of around $109.7 billion, with expected

USD/JPY and USD/CHF Near Key Levels: The Dollar Supported by the Fed
The US dollar continues to trend upwards following the Federal Reserve meeting, drawing support from the regulator’s moderately hawkish stance and comments by Jerome Powell. Markets interpret the Fed’s rhetoric as a signal that restrictive policy is likely

EUR/USD and GBP/USD consolidate ahead of the Fed decision
European currencies are showing subdued dynamics, entering a consolidation phase following their previous advance. Earlier, EUR/USD and GBP/USD broke out of their ranges and strengthened; however, the subsequent correction has led both pairs to retest the previously breached