


FXOpen

While bitcoin is making new multi-year highs, the rest of the altcoin market is not doing so great. After a brief respite at the start of the month, Ether is back to making new lows on a daily basis. Dash has joined the selling party by breaking below the important support at 0.011 BTC.
More Losses for Ether
Ether investors can’t catch a break. The crypto is down almost 26 percent in the past two weeks. Out of 28 trading days this month, so far only 10 days have closed in the green, with only 3 of those making sizable gains. As you can see on the chart below, this downtrend has been unrelenting.
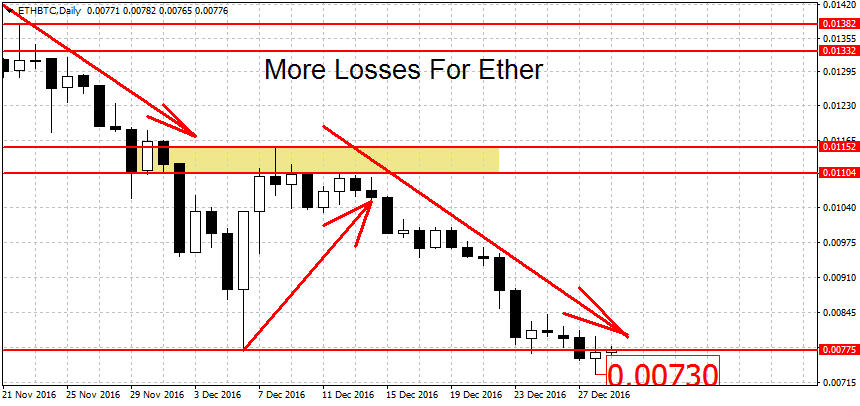
Yesterday we hit a new multi-month low at 0.0073, breaking below the previous monthly low at 0.00775. We have since bounced back slightly and ETH/BTC is quoted right at 0.00775. Naturally this tiny bounce is not enough to end the current trend. For that the bulls will have to break above the 0.01 round figure.
A new uptrend requires a breakout above the 0.01152 swing high as well. More resistance on the upside can be found at 0.01332, closely followed by the 0.01382 swing high and the 0.015 round figure.
On the lower end, we have some resistance at the former monthly low at 0.00775 BTC. We haven’t quite cleared this level yet, despite a break of it few days earlier. The semi-round figure at 0.05 may lend some support as well.
Dash Falls After Failed Breakout
Dash prices failed to rally above the monthly high at 0.01251. While initially DSH/BTC saw some tentative gains of 6 percent, the move higher quickly fizzled out, as can be seen below.
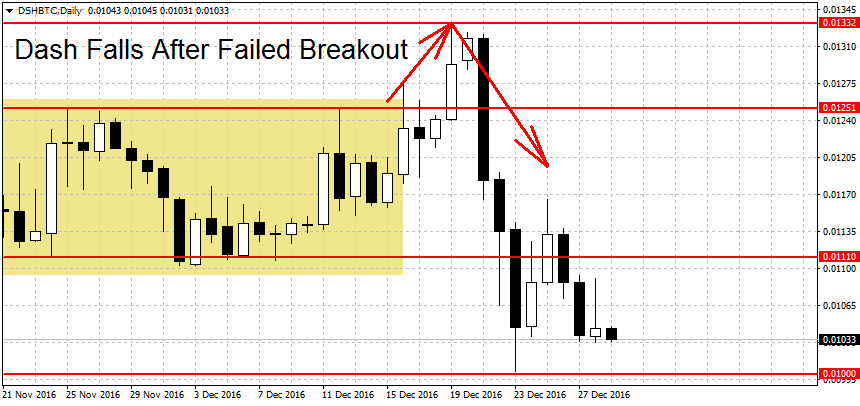
Only three sharp down days later and Dash broke below the monthly low at 0.011, thereby confirming a new downtrend. We haven’t made much progress on the way down either, with prices now quoted at 0.01033. Below here we have support at the 0.01 round figure. This level was confirmed as support with a bounce at 0.01003 on December 23rd. A decisive breakdown below it could exacerbate the losses.
A break of the new monthly high at 0.01332 is needed to switch the trend from down to up. Above here we find resistance levels at 0.014 and 0.01489 BTC. These are closely followed by more resistance at the 0.015 round figure and the former September lows at 0.01741 BTC.
FXOpen offers the world's most popular cryptocurrency CFDs*, including Bitcoin and Ethereum. Floating spreads, 1:2 leverage — at your service. Open your trading account now or learn more about crypto CFD trading with FXOpen.
*At FXOpen UK and FXOpen AU, Cryptocurrency CFDs are only available for trading by those clients categorised as Professional clients under FCA Rules and Professional clients under ASIC Rules respectively. They are not available for trading by Retail clients.
This article represents the opinion of the Companies operating under the FXOpen brand only. It is not to be construed as an offer, solicitation, or recommendation with respect to products and services provided by the Companies operating under the FXOpen brand, nor is it to be considered financial advice.
Stay ahead of the market!
Subscribe now to our mailing list and receive the latest market news and insights delivered directly to your inbox.

Latest articles

Weekly Market Wrap With Gary Thomson: Nasdaq, EUR/USD, USD/CHF, Brent Crude Oil, Googl Shares
Get the latest scoop on the week's hottest headlines, all in one convenient video. Join Gary Thomson, the COO of FXOpen UK, as he breaks down the most significant news reports and shares his expert insights.
- Nasdaq Composite: Worst Session

Analysis of AUD/USD: Exchange Rate Falls to Early May Low
As indicated by the 4-hour AUD/USD chart today:
→ the rate fell below 0.652, a level last seen on May 2;
→ the RSI indicator dropped below 15, a level last seen during the panic over the spread of COVID-19

Analysis of AMZN Stock: Price at 1.5-Month Low
As shown in the AMZN chart, the stock price dropped below:
→ the psychological level of $180;
→ the mid-June interim low.
The last time AMZN traded below $180 was in early June.
Thus, AMZN has faced sell-offs, similar to other tech