


More Problems For Ether
FXOpen
More problems for Ether during the last two weeks as users had to undertake yet another hard fork. Prices have broken the uptrend and look set to move lower instead. Dash on the other hand is already in a downtrend after breaking the 0.01822 swing low nine days ago.
Second Hard Fork for Ether
Ether prices suffered during the past two weeks. The developers rolled out another update due to what appears to be a persistent attack on the network. Initially the successful fork gave a boost to prices with ETH/BTC jumping 8 percent on October 18th. But as we can see on the chart below that rally quickly fizzled out as new attacks emerged. The problems may lead to yet another hard fork for Ether, the third one this year.
Hard forks are controversial in the crypto-space as they (among other risks) could lead to a splintered network. During the first Ether hard fork this year, a sizable percentage of users decided to stick with the original ETH software and called their chain ‘Etherium Classic’.
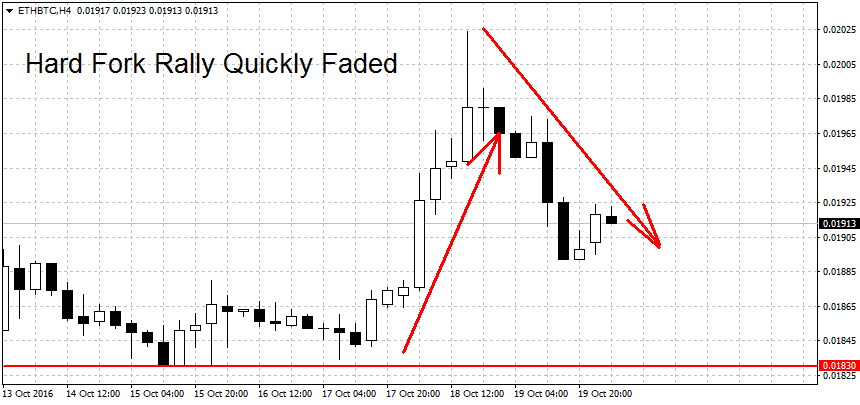
The technical picture for ETH/BTC is precarious for the bulls. Prices are barely holding above the 0.018 level. In the past ten days we hit a low close to 0.0183 on six separate occasions. If the 0.018 round figure breaks, a new downtrend could commence. Below here have support levels at the 0.015 round figure followed by 0.0139, 0.0123 and another round level at 0.01 BTC.
On the upper end a break above the 0.02228 swing high is needed for new uptrend. We have resistance above here at 0.024 and 0.02610 BTC.
Dash Down 17 Percent
Alternative crypto-currency Dash is down close to 18 percent compared to the 0.0197 price noted two weeks ago. We’re now in a strong downtrend that started on October 11th with the break of the 0.01822 swing low.
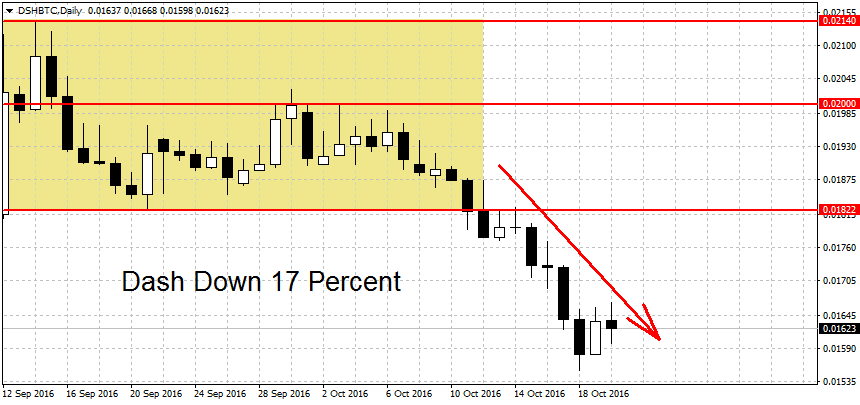
Below current prices, the first support can be found at the 0.015 round figure. This level is closely followed by the 0.01389 spike high and the 0.01267 swing high reached in June of this year. The medium-term picture for DSH/BTC is now neutral but long-term trend is still bullish.
On the upper end a decisive break back above the 0.01822 level will be needed to end the downtrend. A new uptrend requires a break above 0.02026 BTC. We have resistance above here at last month’s high of 0.02140 closely followed by the 0.02248 swing high and 0.02465. Higher still the 0.025 round figure, the August high at 0.02668 BTC and the all-time high at 0.028 are notable resistance levels as well.
FXOpen offers the world's most popular cryptocurrency CFDs*, including Bitcoin and Ethereum. Floating spreads, 1:2 leverage — at your service (additional fees may apply). Open your trading account now or learn more about crypto CFD trading with FXOpen.
*Important: At FXOpen UK, Cryptocurrency trading via CFDs is only available to our Professional clients. They are not available for trading by Retail clients. To find out more information about how this may affect you, please get in touch with our team.
This article represents the opinion of the Companies operating under the FXOpen brand only. It is not to be construed as an offer, solicitation, or recommendation with respect to products and services provided by the Companies operating under the FXOpen brand, nor is it to be considered financial advice.
Stay ahead of the market!
Subscribe now to our mailing list and receive the latest market news and insights delivered directly to your inbox.


Latest articles

Weekly Market Insights with Gary Thomson: The Week of Central Banks and Earnings
In this video, we’ll explore the key economic events and market trends, shaping the financial landscape. Get ready for insights into financial markets to help you navigate the week ahead. Let’s dive in!
In this episode of Market

Intel at a Crossroads: Earnings Beat Meets Technical Resistance
Intel has just delivered its strongest quarter in over fifteen years, and the market reaction says it all. Q2 2026 revenue surged 25% year-over-year to $16.1 billion, crushing the consensus estimate of $14.42 billion, while adjusted EPS of

Tesla: Complex Range Structure Breaks Down Following Quarterly Earnings
Tesla released its Q2 2026 results after the market closed on 22 July. Revenue increased 26% year-on-year to $28.24 billion, while vehicle deliveries reached a record 480,126 units. However, operating margin fell sharply to 1.4%, down from