


Namecoin Breaks Down, Peercoin Nears Support
FXOpen
It’s time for another Peercoin/Namecoin update. The two coins had a different fate since our last update 14 days ago. While NMC fell to new lows and into a downward trend, PPC only bounced at support.
Namecoin Breaks Down
Namecoin prices broke down past the $0.27 level last week, hitting a low of $0.236 on October 18th. From here we rallied back up as prices retested the previous support at 27 cents. But now this level acted as resistance, leading to renewed selling. We’re currently quoted at $0.254 per coin.
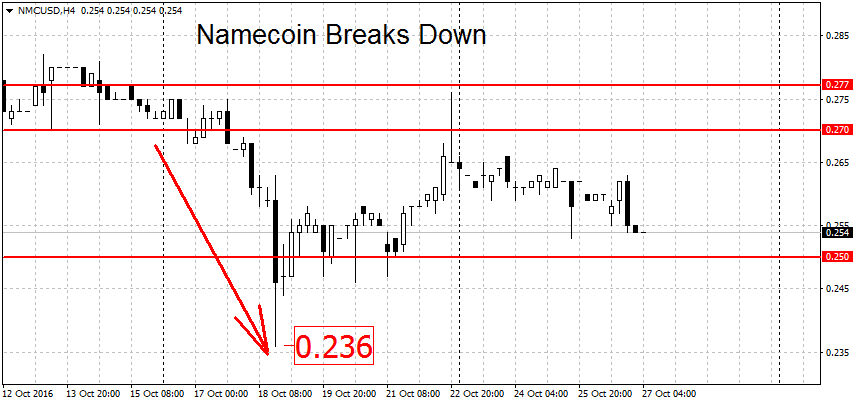
Below current prices weak support can be found at this month’s low at $0.236. This is followed by the round figures at $0.20 and $0.15 dollars. Now all three (short-term, medium-term and long-term) trends for NMC/USD are down.
To end the current downtrend, the bulls will have to push prices back above the 27 cents former support now turned resistance. To repeat again, we’re looking for a decisive break of the resistance level, not just a brief spike above. For example, last Saturday prices got bid up as high as $0.276 before the bears were able to take charge again.
A new uptrend requires a breakout above the 30 cents level. Higher up we find resistance at the two-month high of $0.32 and the $0.346 swing high. These levels are followed by more notable resistance at $0.371 and $0.40 per coin.
Peercoin Bounces at Support
In our last article we identified the $0.272-$0.282 area as potential support. Last week PPC/USD strongly bounced in this area, after dipping slightly below the level to $0.269. The subsequent rally took prices to a high of 29 cents. But those gains didn’t last and soon Peercoin fell back down toward the same support area. We’re now trading just above it at $0.276 dollars per coin.
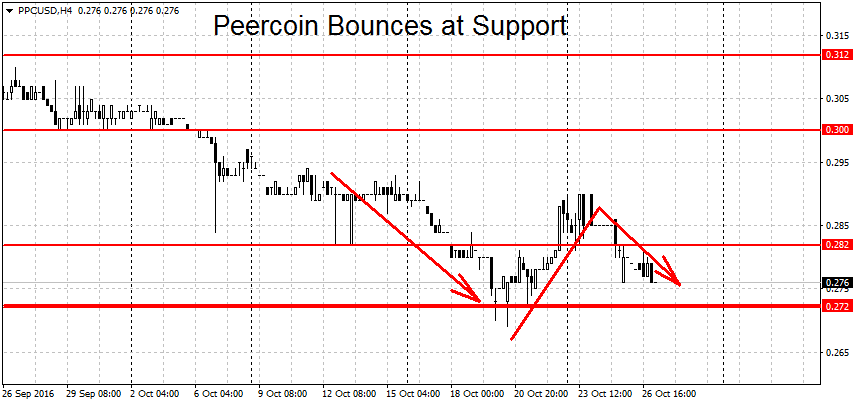
A decisive break below $0.269 could start a new PPC downtrend. Below here we have a support at the $0.237 spike low followed by the swing low at $0.211.
On the upper end, a clean break above the 30 cents round figure may start a new rally. Above here we have weak resistance at the $0.312 swing high followed by a stronger level consisting of several spike highs near 35 cents per coin. Higher still we find a resistance area around 39-40 cents. A clearing of this area could lead to more gains for Peercoin.
FXOpen offers the world's most popular cryptocurrency CFDs*, including Bitcoin and Ethereum. Floating spreads, 1:2 leverage — at your service (additional fees may apply). Open your trading account now or learn more about crypto CFD trading with FXOpen.
*Important: At FXOpen UK, Cryptocurrency trading via CFDs is only available to our Professional clients. They are not available for trading by Retail clients. To find out more information about how this may affect you, please get in touch with our team.
This article represents the opinion of the Companies operating under the FXOpen brand only. It is not to be construed as an offer, solicitation, or recommendation with respect to products and services provided by the Companies operating under the FXOpen brand, nor is it to be considered financial advice.
Stay ahead of the market!
Subscribe now to our mailing list and receive the latest market news and insights delivered directly to your inbox.


Latest articles

EUR/USD and GBP/USD consolidate ahead of the Fed decision
European currencies are showing subdued dynamics, entering a consolidation phase following their previous advance. Earlier, EUR/USD and GBP/USD broke out of their ranges and strengthened; however, the subsequent correction has led both pairs to retest the previously breached

Meta: V-Shaped Recovery Meets Heavy Volume Resistance
The movement in Meta Platforms shares is being driven by two competing narratives. On one hand, advertising revenue is benefiting from AI-based tools: the Advantage+ platform continues to support strong advertiser demand, and the analyst consensus for Q1 2026 revenue

Commodity Currencies Test Key Levels Ahead of Major Macro Data
Commodity-linked currencies are trading near key levels, showing restrained price action as market participants adopt a wait-and-see approach. The fundamental backdrop is shaped by expectations surrounding the release of Australia’s inflation data and the Bank of Canada’s interest