


Namecoin Breaks Yearly Low, Peercoin Flat
FXOpen
Since our last update , bitcoin prices eased up a bit after a failure to move higher. Tuesday’s push stopped short of breaking the $335 level at $334.46 and since then BTC has been in a steady slide lower. We are currently quoted at $319 per coin, about $15 dollars off the December 23rd highs. Bitcoin’s move lower translated to more losses for altcoins. Namecoin broke its yearly low of $0.75 yesterday and Litecoin continued the downtrend, falling to a new low of $2.67 today.
Namecoin Breaks 2014 Low
After hovering above $0.75 for a couple of days, alternative cryptocurrency Namecoin broke the important yearly low yesterday. The fall hasn’t had much follow-through as of yet, NMC is trading at $0.738 at the moment.
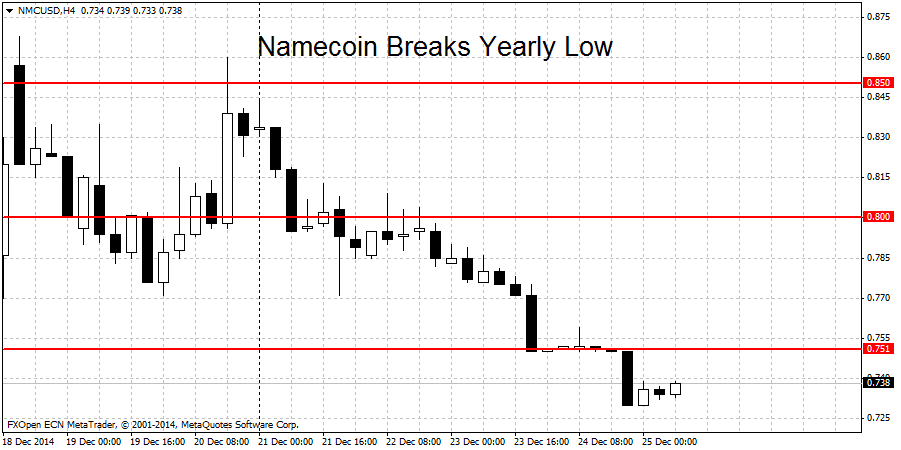
The break of $0.75 may lead to more losses toward $0.70. Important levels on the downside may include $0.60 and $0.50. On the upside, a breakout above $0.85 should end the downtrend. As we always say, whenever trading altcoins you should keep one eye on big brother bitcoin. This is because the prevailing BTC trend will usually spill over and influence altcoin prices. The most recent example of this was Namecoin itself. After an initial strong performance last week, NMC eventually joined the downtrend and hit new lows this week.
Peercoin Flat After $0.50 Bounce
Peercoin is trading flat this week after a bounce near the half-parity level at $0.50. Last week’s move lower stopped at $0.514. We are now trading about 10 percent higher at $0.563. To resume the momentum lower, we would need to see a break of $0.50.
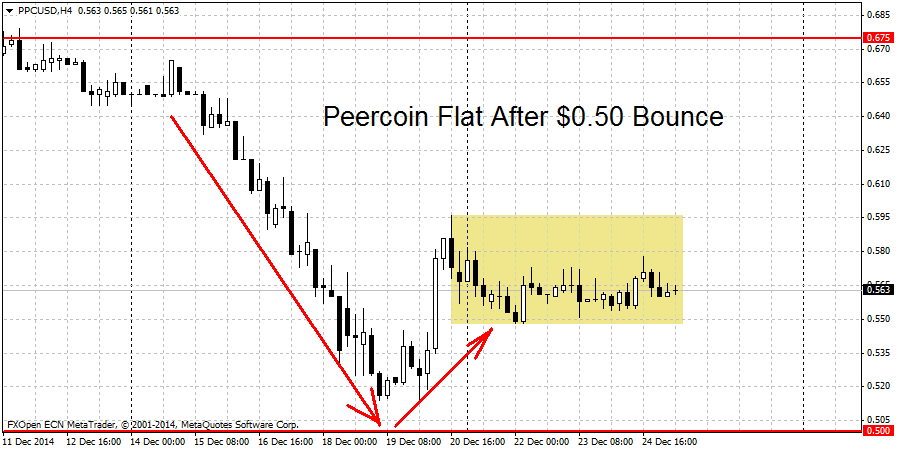
On the upside, the downtrend may be snapped if PPC/USD manages to climb back above $0.70. Don’t forget to watch bitcoin’s movements. The important BTC levels are $335 on the upside and $300 on the downside. A break of $335 should end the BTC downtrend and may lead to stabilization in altcoin prices. A decisive move below $300 could intensify the current altcoin downtrend.
Due to the coming holiday season (December 25th – January 2nd) volatility and liquidity may be lower. This is turn may translate into smaller ranges and unpredictable price movements. A quick look at last year’s Christmas period shows that the 14 period Average Daily Range, a measure of volatility, fell by over 50 percent during December 25th 2013 – January 2nd 2014. So be careful out there and Happy Holidays!
FXOpen offers the world's most popular cryptocurrency CFDs*, including Bitcoin and Ethereum. Floating spreads, 1:2 leverage — at your service (additional fees may apply). Open your trading account now or learn more about crypto CFD trading with FXOpen.
*Important: At FXOpen UK, Cryptocurrency trading via CFDs is only available to our Professional clients. They are not available for trading by Retail clients. To find out more information about how this may affect you, please get in touch with our team.
This article represents the opinion of the Companies operating under the FXOpen brand only. It is not to be construed as an offer, solicitation, or recommendation with respect to products and services provided by the Companies operating under the FXOpen brand, nor is it to be considered financial advice.
Stay ahead of the market!
Subscribe now to our mailing list and receive the latest market news and insights delivered directly to your inbox.


Latest articles

DAX 40: consolidation amid technology sell-off
A wave of selling in the technology sector that emerged earlier this week has weighed on European equities. The trigger was investor concern over the profitability of large-scale debt-funded investments by major US tech companies in AI infrastructure. The Nasdaq

Euro Hits Fresh Yearly Lows Amid Dovish ECB Signals
The euro remains under pressure following weak macroeconomic data from the euro area and fresh signals that the European Central Bank is prepared to maintain a more accommodative monetary policy stance. Data released yesterday pointed to a deterioration in business

Pound at Key Levels: Markets Assess Impact of Political Uncertainty in the UK
The British pound remains under pressure following increased political uncertainty in the United Kingdom triggered by the Prime Minister’s resignation. Investors are assessing potential shifts in the political and economic policy outlook after the head of government stepped down,