


Namecoin Joins Peercoin in Rally
FXOpen
Today Namecoin prices broke above the $0.242 swing high and began and new uptrend. It joins Peercoin which has been in rally mode for most of January. This uptrend continues into the new month.
Peercoin Rally Continues
Peercoin prices are still in rally mode as the altcoin trends higher, albeit slowly. Since our last update 14 days ago no new highs have been reached. Prices peaked at $0.313 on January 17th and during the past two weeks we only traded as high as $0.304 (today). But the overall direction remains up, as can be seen on the chart below.
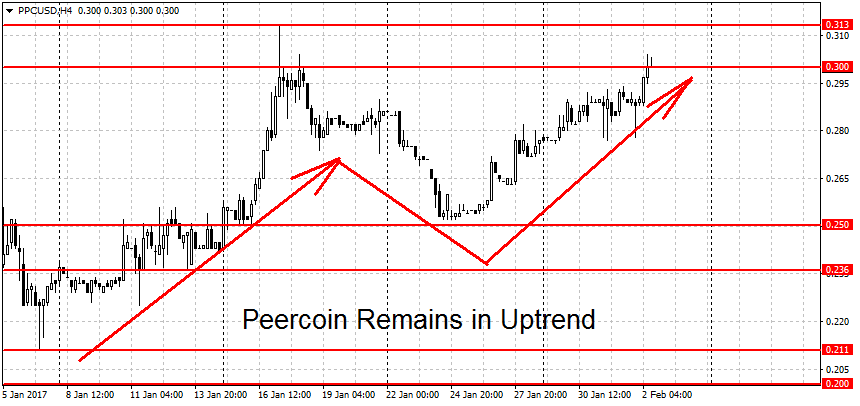
To end the current uptrend the bears have to push prices below 25 cents. A decisive break below $0.236 could start a new downtrend in prices.
On he upside we have resistance at the 30 cents round figure, followed by this year’s high at $0.313. A breakout above here could lead to more gains. Higher up we find resistance near the 35 cents level and the $0.388 swing high. These are followed by the 40 and 50 cents round figures and the $0.524 swing high. On the longer-term (weekly and monthly) charts PPC/USD is neutral, neither bullish nor bearish.
Namecoin Joins Uptrend
Namecoin joined Peercoin in an uptrend today as prices broke above the $0.242 swing high. So far no major gains can be seen. Earlier in the day a high of $0.253 was reached but right now we’re quoted at $0.244, not far from the breakout level.
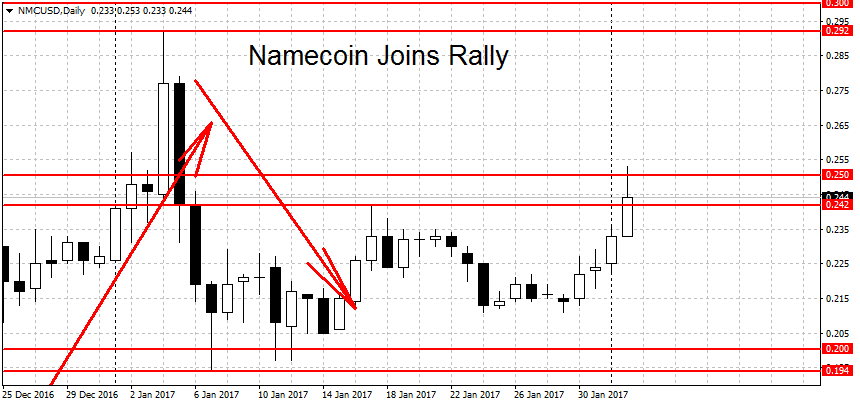
We have resistance on the way up at $0.292 swing high, closely followed by the 30 cents round figure. Higher still the September resistance at $0.32 could act as a lid on prices, at least temporarily. This is followed by the 40 cents round level and the $0.44 swing high.
A decisive break of the $0.212 swing low could end the fledgling uptrend. The 20 cents round figure is weak support. But a stronger support below here can be found at the $0.194 swing low, a move below it may start a new downtrend in prices. Further down we have potential support at last December’s low of $0.162, followed by last year’s low at $0.153. A breakdown below this important milestone could intensify the NMC losses.
On the longer-term charts, NMC/USD is looking mixed. While the weekly chart is neutral, the monthly is still tilting toward the downside.
FXOpen offers the world's most popular cryptocurrency CFDs*, including Bitcoin and Ethereum. Floating spreads, 1:2 leverage — at your service (additional fees may apply). Open your trading account now or learn more about crypto CFD trading with FXOpen.
*Important: At FXOpen UK, Cryptocurrency trading via CFDs is only available to our Professional clients. They are not available for trading by Retail clients. To find out more information about how this may affect you, please get in touch with our team.
This article represents the opinion of the Companies operating under the FXOpen brand only. It is not to be construed as an offer, solicitation, or recommendation with respect to products and services provided by the Companies operating under the FXOpen brand, nor is it to be considered financial advice.
Stay ahead of the market!
Subscribe now to our mailing list and receive the latest market news and insights delivered directly to your inbox.


Latest articles

Weekly Market Insights with Gary Thomson: The Week of Central Banks and Earnings
In this video, we’ll explore the key economic events and market trends, shaping the financial landscape. Get ready for insights into financial markets to help you navigate the week ahead. Let’s dive in!
In this episode of Market

Intel at a Crossroads: Earnings Beat Meets Technical Resistance
Intel has just delivered its strongest quarter in over fifteen years, and the market reaction says it all. Q2 2026 revenue surged 25% year-over-year to $16.1 billion, crushing the consensus estimate of $14.42 billion, while adjusted EPS of

Tesla: Complex Range Structure Breaks Down Following Quarterly Earnings
Tesla released its Q2 2026 results after the market closed on 22 July. Revenue increased 26% year-on-year to $28.24 billion, while vehicle deliveries reached a record 480,126 units. However, operating margin fell sharply to 1.4%, down from