


Namecoin, Peercoin Fail to Join BTC Rally
FXOpen
While bitcoin has gained $37 dollars or 9 percent since last Thursday, both Namecoin and Peercoin are trading little changed. Namecoin is actually down by 0.7 cents compared to one week ago, while PPC/USD is higher by the same amount.
Peercoin Up by 1.6 Percent
Alternative cryptocurrency Peercoin failed to join in the bitcoin rally. Prices advanced by only 0.7 cents, from $0.418 to $0.425 dollars per coin, for a total gain of 1.6 percent. Prices traded in quite a wide range last week, hitting $0.446 on Saturday but later falling to a low of $0.409 on Monday. But ultimately we stabilized around $0.425, this is where PPC has been trading for the past two days.
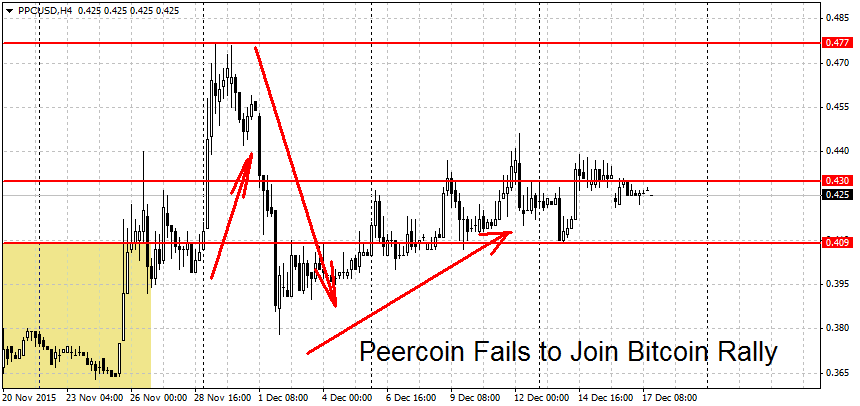
The Peercoin rally is still technically in place. The bears will need to make a decisive push below the 40 cents round figure to end the uptrend. However caution is advised. The complete lack of progress while big brother bitcoin gained 9 percent doesn’t bode well for the PPC bulls. A bitcoin reversal or even a sizable move lower would likely lead to large selling pressure in Peercoin. A breakdown below the $0.378 low would start a new downtrend for PPC/USD.
On the upside, we will need to see a break above the $0.477 high to renew the lost momentum higher. Resistance above here can be found at the 50 cents round figure, followed by the November 4th swing high at $0.579 dollars.
Namecoin Fails to Join Rallies
Namecoin is still refusing to join the Bitcoin and Peercoin rallies. Prices remain locked in a range, we will need to see a large move in either direction to break the current deadlock. The numbers ”to beat” are $0.50 on the upside and $0.412 on the downside. We marked the current range with a yellow rectangle on the chart below.
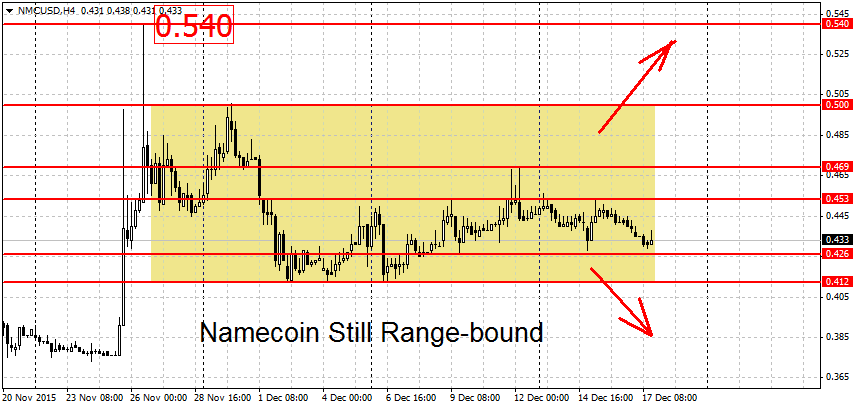
Below current prices, weak support can be found around the $0.426 double bottom. But it will take a decisive break of the $0.412 lows to start a new NMC downtrend. Lower still we have weak support at the round 40 cents level, followed by a stronger level near the $0.359 swing low.
On the higher end, we find two weaker resistance levels at $0.453 and $0.469. But the bulls will need to make a clean break above the $0.50 figure to start a new rally. Further up, the next line of resistance can be found at the November 26th high at $0.54, followed by $0.666 and the July swing high at $0.717 dollars per coin.
FXOpen offers the world's most popular cryptocurrency CFDs*, including Bitcoin and Ethereum. Floating spreads, 1:2 leverage — at your service (additional fees may apply). Open your trading account now or learn more about crypto CFD trading with FXOpen.
*Important: At FXOpen UK, Cryptocurrency trading via CFDs is only available to our Professional clients. They are not available for trading by Retail clients. To find out more information about how this may affect you, please get in touch with our team.
This article represents the opinion of the Companies operating under the FXOpen brand only. It is not to be construed as an offer, solicitation, or recommendation with respect to products and services provided by the Companies operating under the FXOpen brand, nor is it to be considered financial advice.
Stay ahead of the market!
Subscribe now to our mailing list and receive the latest market news and insights delivered directly to your inbox.


Latest articles

EUR/USD and GBP/USD consolidate ahead of the Fed decision
European currencies are showing subdued dynamics, entering a consolidation phase following their previous advance. Earlier, EUR/USD and GBP/USD broke out of their ranges and strengthened; however, the subsequent correction has led both pairs to retest the previously breached

Meta: V-Shaped Recovery Meets Heavy Volume Resistance
The movement in Meta Platforms shares is being driven by two competing narratives. On one hand, advertising revenue is benefiting from AI-based tools: the Advantage+ platform continues to support strong advertiser demand, and the analyst consensus for Q1 2026 revenue

Commodity Currencies Test Key Levels Ahead of Major Macro Data
Commodity-linked currencies are trading near key levels, showing restrained price action as market participants adopt a wait-and-see approach. The fundamental backdrop is shaped by expectations surrounding the release of Australia’s inflation data and the Bank of Canada’s interest