


Technical Analysis on April 18, 2023: XRPUSD Formed an Inverted Hammer Pattern Above $0.5041
FXOpen

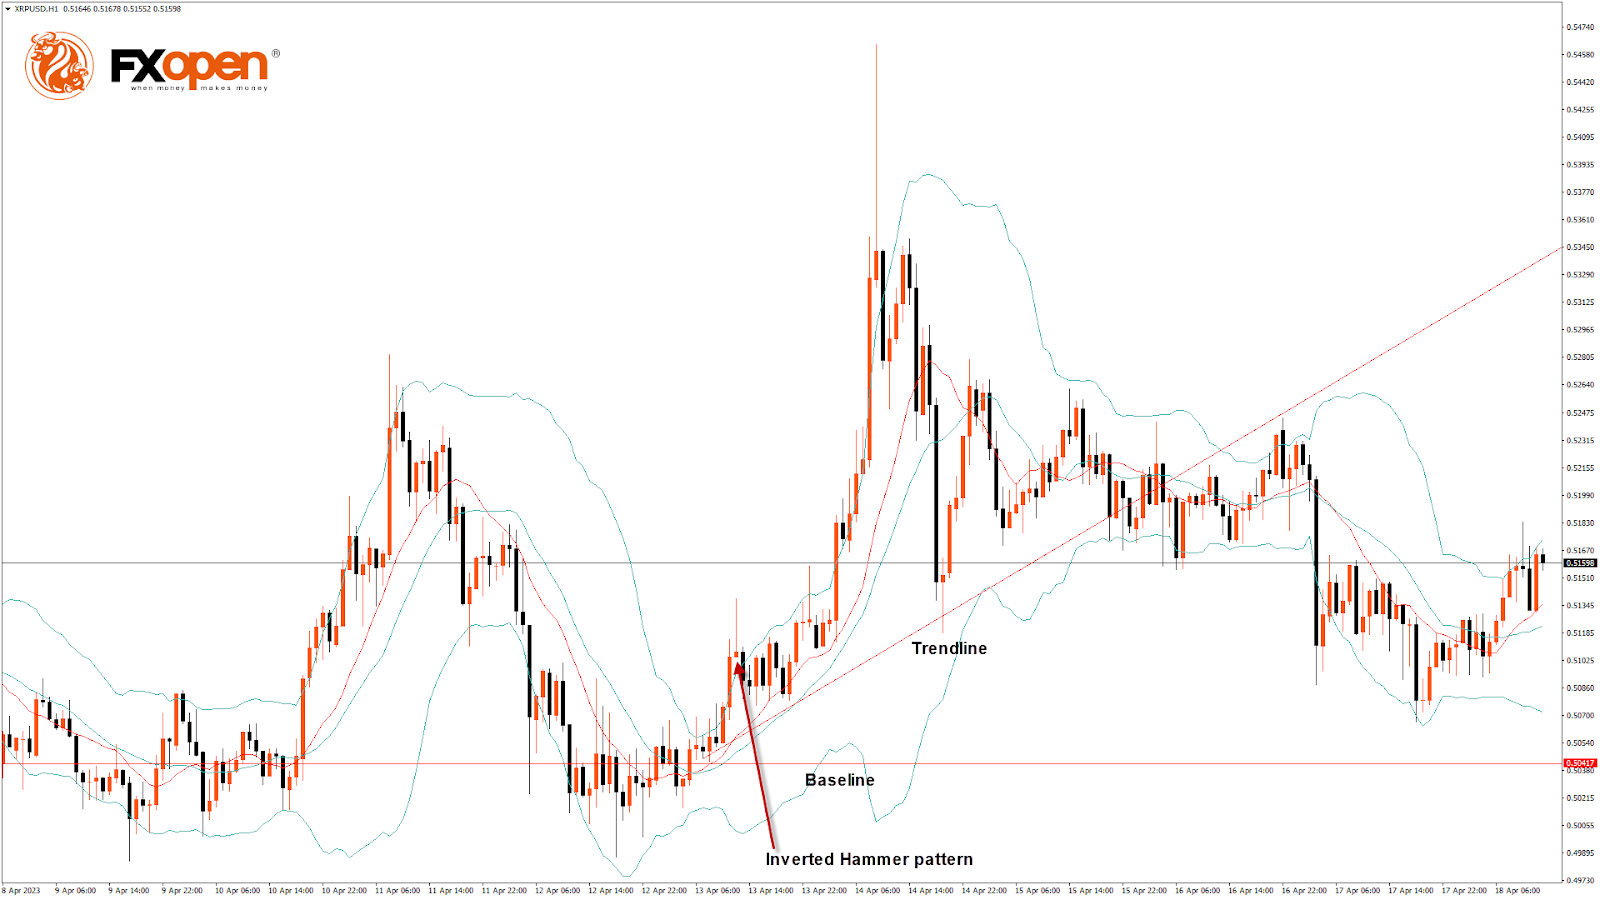
Last week, the market sentiment turned bullish after Ripple touched a low of $0.5041 on April 13 and started to correct. The market opened bullish this week.
On the hourly chart:
- The relative strength index is at 61.54, which signifies a strong demand for Ripple at the current market prices and the continuation of the bullish phase in the market.
- Moving averages signal an upward price movement at the current market level of $0.5200.
- Both the STOCHRSI and Williams’s percent range are in the overbought zones, which means the price is expected to decline.
- Ripple is now trading just above its pivot level of $0.5158. It has already crossed its classic resistance at $0.5188, and it is facing Fibonacci resistance at $0.5271, after which it will be able to move towards $0.5500.
Some of the major technical indicators are bullish.
- Ripple bullish reversal is seen above $0.5041.
- The price is above its pivot level.
- The average true range indicates low volatility.
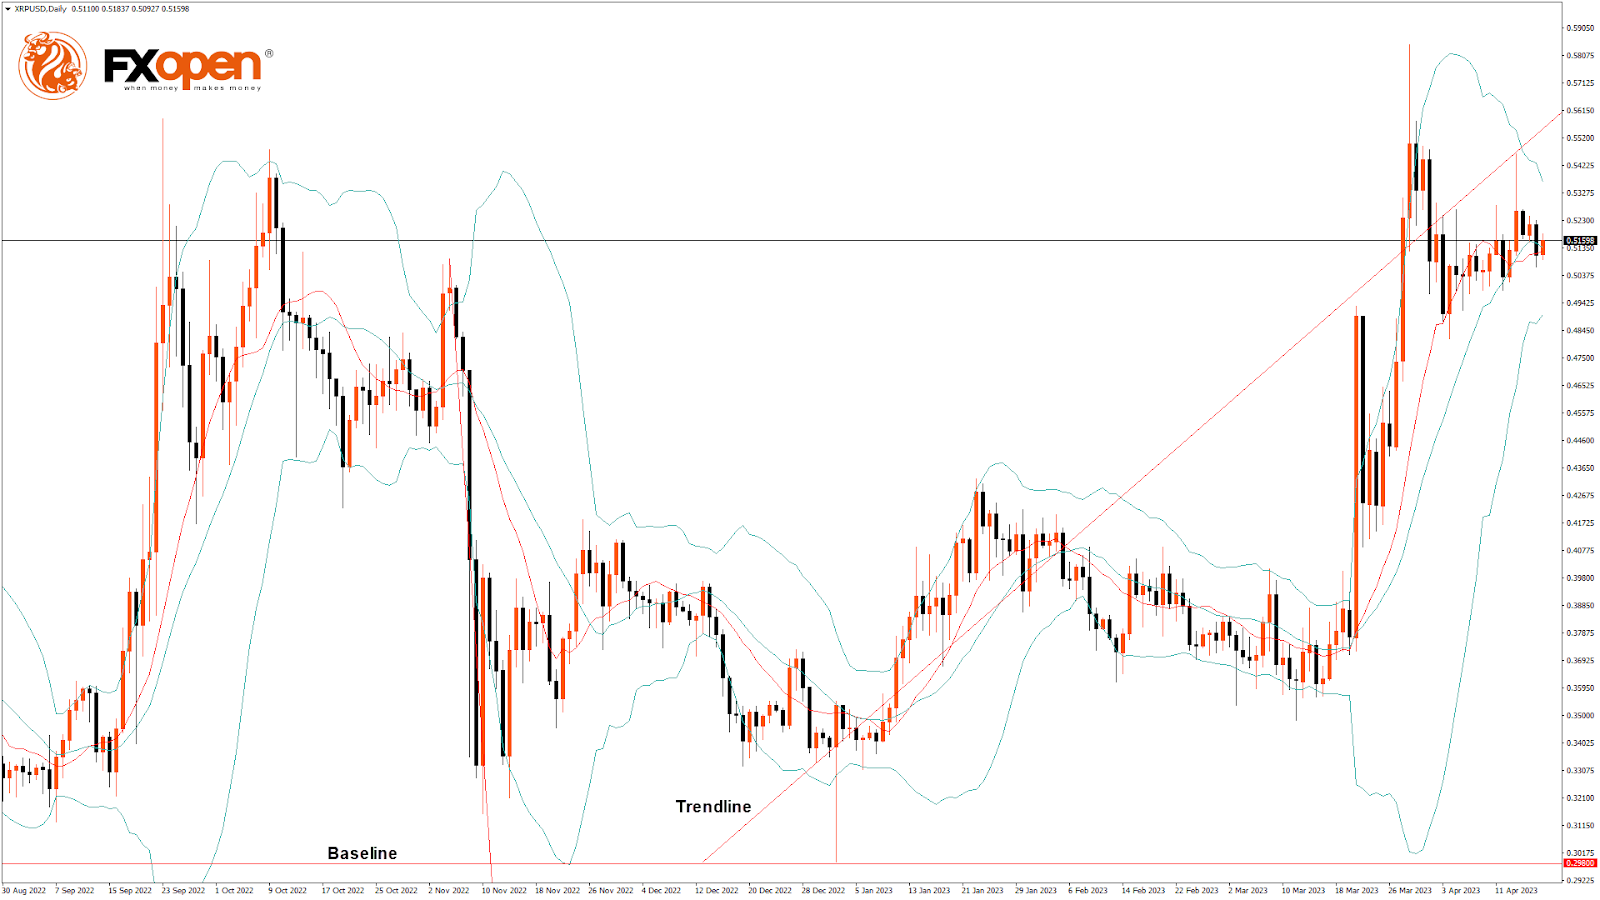
We have also detected a bullish price crossover with 50- and 100-period moving averages in the daily timeframe.
Ripple Bullish Reversal Seen Above $0.5041
We can see that Ripple continues to move bullish, and further resistance levels are at 0.5400 and 0.5500. There is a bullish Harami pattern in the daily timeframe.
The Parabolic SAR indicator gives a bullish reversal signal in the 30-minute timeframe.
The Aroon indicator is signaling a bullish trend in the 15-minute timeframe.
The short-term outlook for Ripple has turned bullish, the medium-term outlook is bullish, and the long-term outlook is neutral.
We can see an increase of around 8.74% in the trading volumes of Ripple as compared to yesterday, which is normal.
This Week Ahead
Ripple continues its bullish momentum from last week and has managed to cross the $0.5400 level. The next visible targets are located at $0.5600 and $0.6000.
Now, the prices have entered a consolidation zone, after which fresh bullish moves are expected.
The resistance level is located at $0.5339, which is 14-3 daily raw stochastic at 50.
We can see a continuous progression of a bullish trend line formation from $0.5041 to $0.5345.
The support level is located at $0.5021, which is a 38.2% retracement from the 4-week High, and at $0.5035, which is the first support pivot point.
The weekly outlook for Ripple is $0.5700 with a consolidation zone of $0.5500.
This forecast represents FXOpen Companies’ opinion only, it should not be construed as an offer, invitation, or recommendation with respect to FXOpen Companies’ products and services or as financial advice.
FXOpen offers the world's most popular cryptocurrency CFDs*, including Bitcoin and Ethereum. Floating spreads, 1:2 leverage — at your service (additional fees may apply). Open your trading account now or learn more about crypto CFD trading with FXOpen.
*Important: At FXOpen UK, Cryptocurrency trading via CFDs is only available to our Professional clients. They are not available for trading by Retail clients. To find out more information about how this may affect you, please get in touch with our team.
This article represents the opinion of the Companies operating under the FXOpen brand only. It is not to be construed as an offer, solicitation, or recommendation with respect to products and services provided by the Companies operating under the FXOpen brand, nor is it to be considered financial advice.
Stay ahead of the market!
Subscribe now to our mailing list and receive the latest market news and insights delivered directly to your inbox.


Latest articles

AUD/CAD: Months of Indecision — Is a Breakout Finally Coming?
The Australian dollar has clawed back most of its end-of-June losses, when it touched three-month lows against the greenback amid escalating Middle East tensions. Since then, sentiment has improved: the RBA's Assistant Governor Sarah Hunter signalled the board stands ready

USD/JPY: Battling at the Top of the Triangle
On 3 July, Japan's Finance Minister, Satsuki Katayama, stated that the Ministry of Finance remains in close contact with US authorities regarding developments in USD/JPY as the yen traded near its weakest level in almost 40 years. Similar verbal

Dow Jones (DJIA): Consolidation Beyond the Trend
Federal Reserve Chair Kevin Warsh testified before Congress on 14–15 July, reaffirming the Fed's commitment to bringing inflation back to target while providing no clear guidance on the future path of interest rates. Meanwhile, June inflation data came in