


Bitcoin Price Risks Not Staying above $50k
FXOpen

On February 14, a strong bullish impulse was recorded in the BTC/USD market, which pushed the price of bitcoin to the area above USD 50k.
The main driver of growth was the effect of the launch of a bitcoin ETF. More than a month has passed since this event, and according to media reports, the ETF has seen an influx of more than USD 7 billion. For example, BlackRock has about 125k bitcoins on its balance sheet to support its ETF fund.
Also adding to the positive mood among market participants is news about the benefits received by companies that invested in bitcoin: MicroStrategy, Block and others. Among the latest news is Reddit's decision to invest in bitcoin.
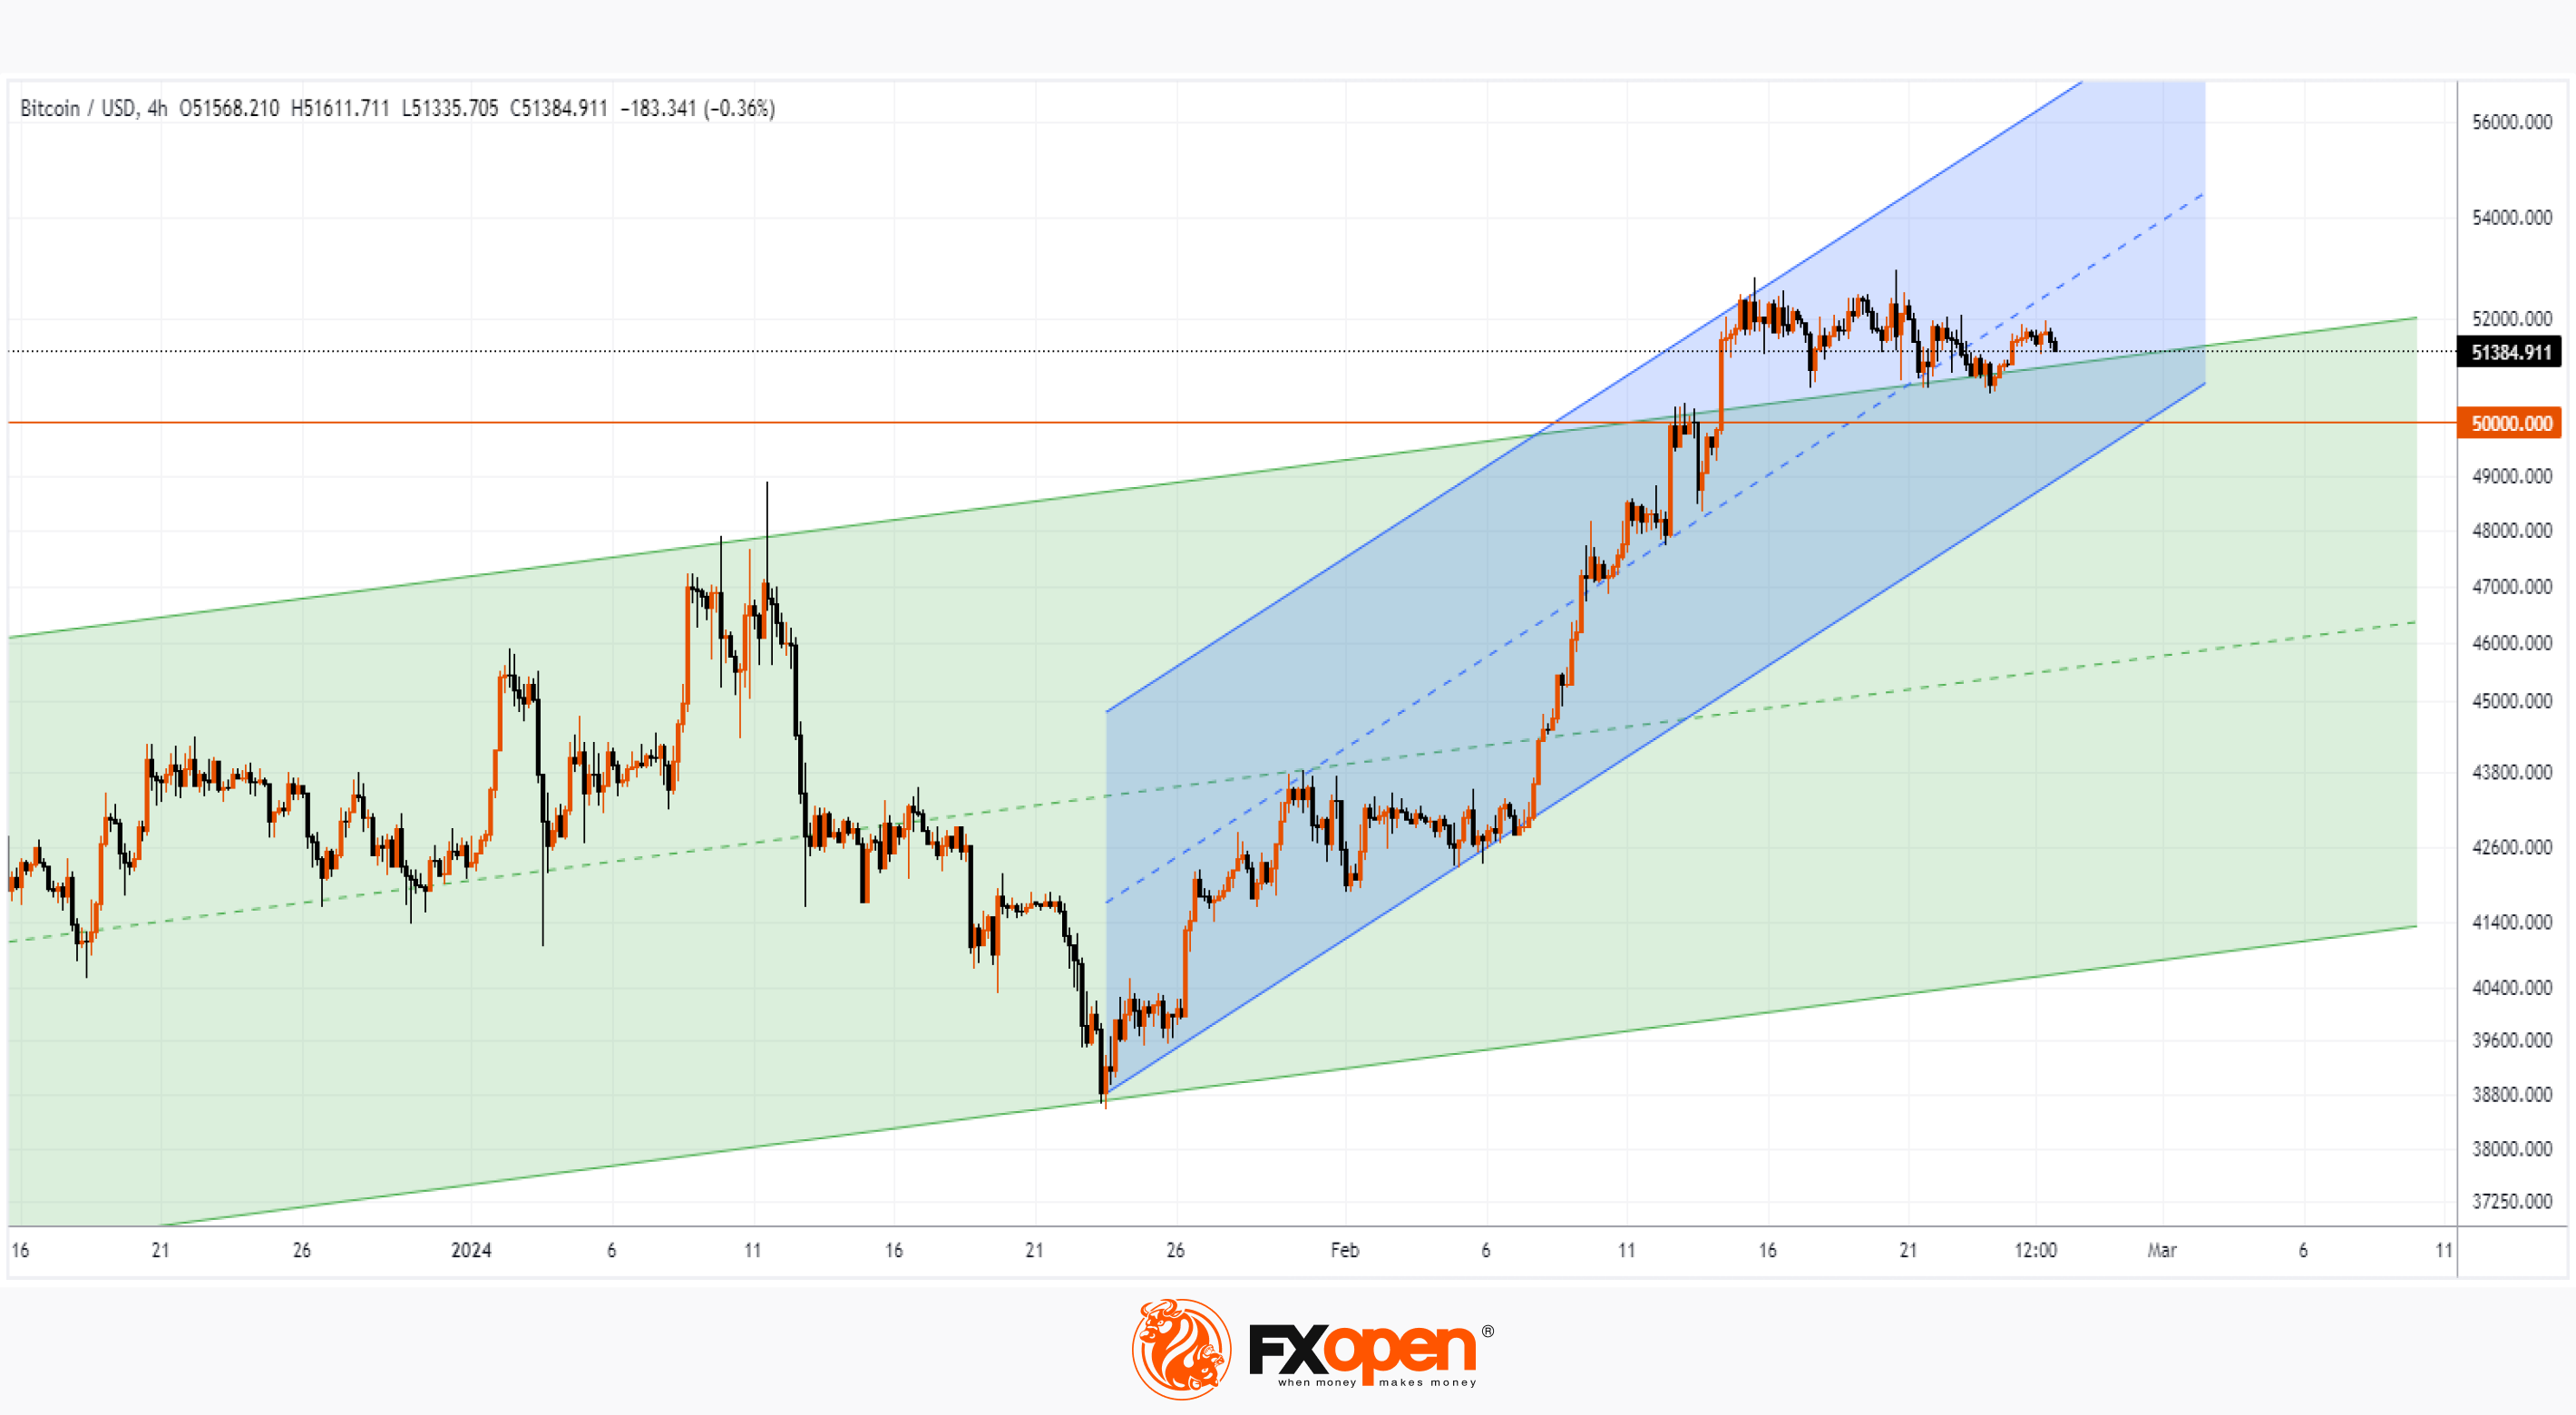
However, technical analysis of the BTC/USD chart shows alarming signs:
→ bitcoin price has slightly exceeded the upper limit of the larger ascending channel (shown in green), but how does it behave in tests? The upper border has changed its role from resistance to support (according to the classic technical analysis pattern), but rebounds from this support line quickly lose momentum. The price does not seem to have the energy (force of demand) to rise from the existing support level.
→ Bitcoin price dropped to the lower border of a smaller ascending channel (shown in blue) - a sign that the February positive is running out.
Given the signs of weakening demand, it is possible that we will see an attempt by the bears to take the initiative and return the price of bitcoin below the psychological level of 50k per coin.
FXOpen offers the world's most popular cryptocurrency CFDs*, including Bitcoin and Ethereum. Floating spreads, 1:2 leverage — at your service (additional fees may apply). Open your trading account now or learn more about crypto CFD trading with FXOpen.
*Important: At FXOpen UK, Cryptocurrency trading via CFDs is only available to our Professional clients. They are not available for trading by Retail clients. To find out more information about how this may affect you, please get in touch with our team.
This article represents the opinion of the Companies operating under the FXOpen brand only. It is not to be construed as an offer, solicitation, or recommendation with respect to products and services provided by the Companies operating under the FXOpen brand, nor is it to be considered financial advice.
Stay ahead of the market!
Subscribe now to our mailing list and receive the latest market news and insights delivered directly to your inbox.


Latest articles

Weekly Market Insights with Gary Thomson: The Week of Central Banks and Earnings
In this video, we’ll explore the key economic events and market trends, shaping the financial landscape. Get ready for insights into financial markets to help you navigate the week ahead. Let’s dive in!
In this episode of Market

Intel at a Crossroads: Earnings Beat Meets Technical Resistance
Intel has just delivered its strongest quarter in over fifteen years, and the market reaction says it all. Q2 2026 revenue surged 25% year-over-year to $16.1 billion, crushing the consensus estimate of $14.42 billion, while adjusted EPS of

Tesla: Complex Range Structure Breaks Down Following Quarterly Earnings
Tesla released its Q2 2026 results after the market closed on 22 July. Revenue increased 26% year-on-year to $28.24 billion, while vehicle deliveries reached a record 480,126 units. However, operating margin fell sharply to 1.4%, down from