


Bitcoin Price Starts the Year with Bullish Sentiment
FXOpen

The first Bitcoin block, also known as the genesis block, was mined on January 3, 2009 at 18:15:05 UTC. 15 years have passed and the value of Bitcoin is in the tens of thousands of US dollars.
In the first days of 2023, bitcoin was worth about $16,600 — and, as it turned out, this was the minimum. After all, then the BTC/USD rate went up and by the end of 2023 reached $44,000. The change was more than +150%!
On January 3, 2024, the price was already above $45,000, giving hope to the bulls that 2024 will be no less successful. If in the coming 2024 BTC/USD repeats the progress of last year, this will mean exceeding the psychological mark of USD 100,000 per coin!
What will influence the price of Bitcoin in the first half of the year?
→ Expected approval of applications for BTC ETF by the SEC regulator. On the one hand, approval will allow a wide range of people to simply invest in Bitcoin, which should increase demand. On the other hand, waiting for approval takes too long. And if it happens, it is possible that a price reduction may occur according to the “buy rumours, sell facts” principle.
→ Approximately, halving will occur in April. This will happen after the 210,000th block is mined. After the halving, miners' block rewards will be reduced from 6.25 BTC to 3.125 BTC. It is believed that this should reduce the supply of coins on the market — accordingly, the price of BTC/USD may rise (and history suggests this).
→ Fed rate cut. Easing monetary policy can serve as a driver for the growth of investment in risky assets, which is Bitcoin.
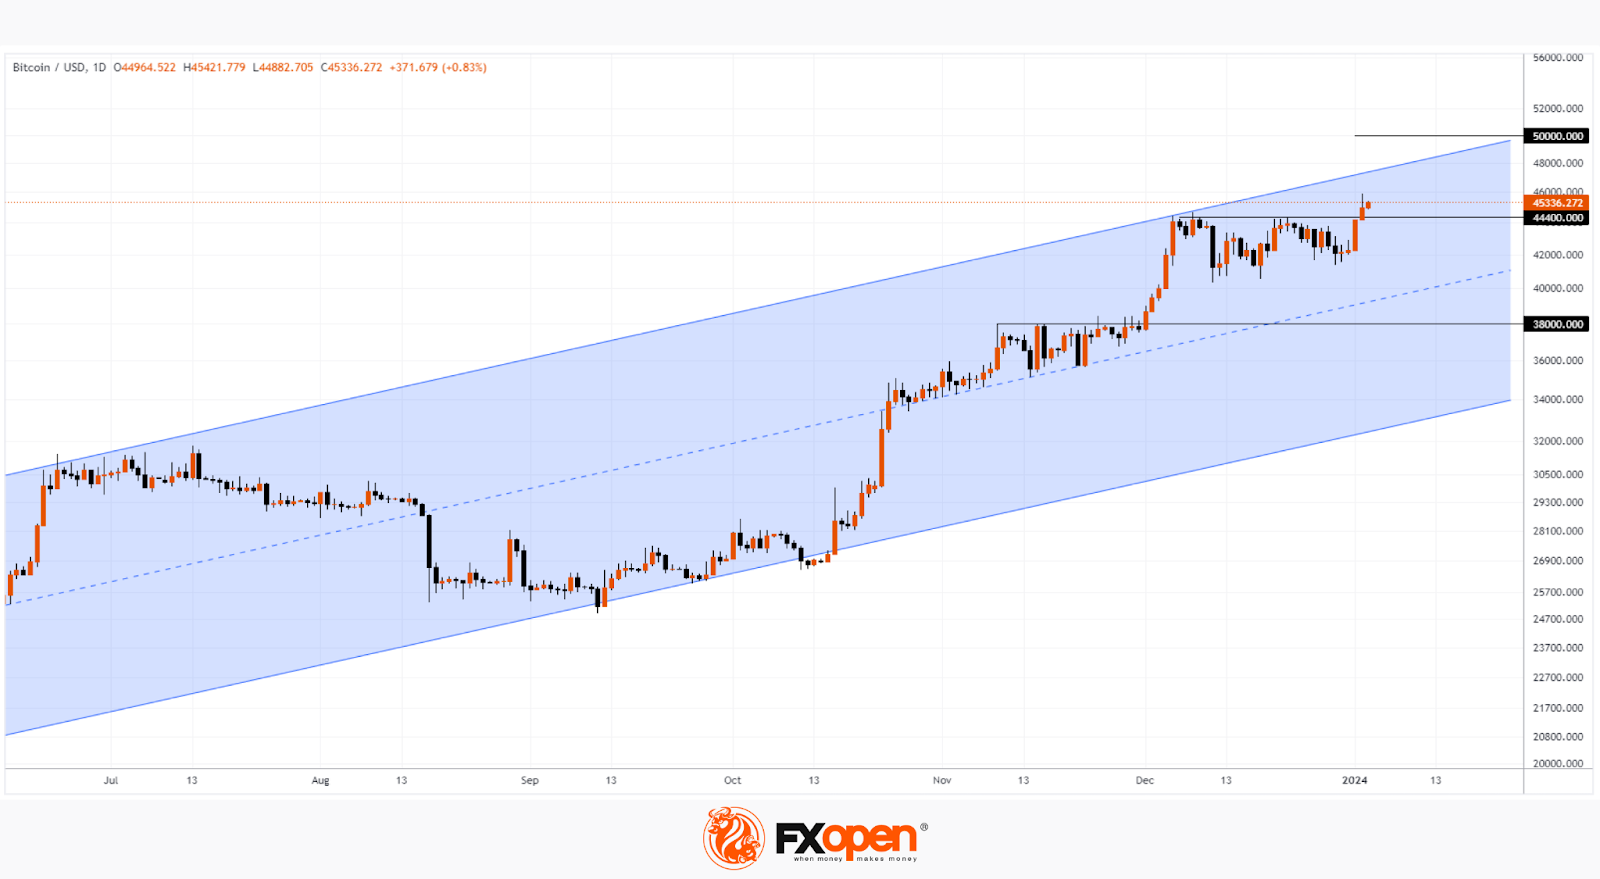
The BTC/USD daily chart shows that:
→ the price of Bitcoin is within the ascending channel;
→ the price broke through the resistance level of $44,400 per coin.
In this case, a comparison with the recent breakdown of the level of 38,000 is appropriate. If the price acts in the same bullish manner, it may consolidate above 44,400, without even testing this former resistance level.
If the demand for Bitcoin does not exhaust itself, the price may reach the upper boundary of the channel and drift towards the psychological mark of $50k. A return below the $44,000 level will mean a big setback for the bulls and will give reason to consider bearish scenarios, up to a breakdown of the current channel.
FXOpen offers the world's most popular cryptocurrency CFDs*, including Bitcoin and Ethereum. Floating spreads, 1:2 leverage — at your service (additional fees may apply). Open your trading account now or learn more about crypto CFD trading with FXOpen.
*Important: At FXOpen UK, Cryptocurrency trading via CFDs is only available to our Professional clients. They are not available for trading by Retail clients. To find out more information about how this may affect you, please get in touch with our team.
This article represents the opinion of the Companies operating under the FXOpen brand only. It is not to be construed as an offer, solicitation, or recommendation with respect to products and services provided by the Companies operating under the FXOpen brand, nor is it to be considered financial advice.
Stay ahead of the market!
Subscribe now to our mailing list and receive the latest market news and insights delivered directly to your inbox.


Latest articles

NVIDIA: Kyber NVL144 Dispute Weighs on the Stock
NVIDIA shares found themselves at the centre of debate over the future of the Kyber NVL144 system. On 6 July, CNBC, citing research firm SemiAnalysis, reported that the project could be delayed by more than a year—from 2027 to
EUR/GBP: Trendline Support or Breakdown to New Lows?
EUR/GBP has slid to its weakest level in a year, as the two currencies continue to follow increasingly divergent paths. The ECB's June hike—its first since 2023—was meant to signal renewed hawkishness, but the very next inflation

USD/CAD: One Trendline Away From Deciding the Next Move
After several strongly positive weeks, USD/CAD has stalled over the past few sessions, entering a phase of uncertainty.
On the dollar side, Fed Chair Kevin Warsh has struck a firm tone, reaffirming the 2% inflation target and pushing back