


Brent Oil Price Retreats from a 3-Month High
FXOpen

On January 6, while analysing the XBR/USD chart, we:
→ constructed an upward structure using blue trend lines;
→ highlighted the potential for a pullback after the formation of peaks A and B around the $76.20 level.
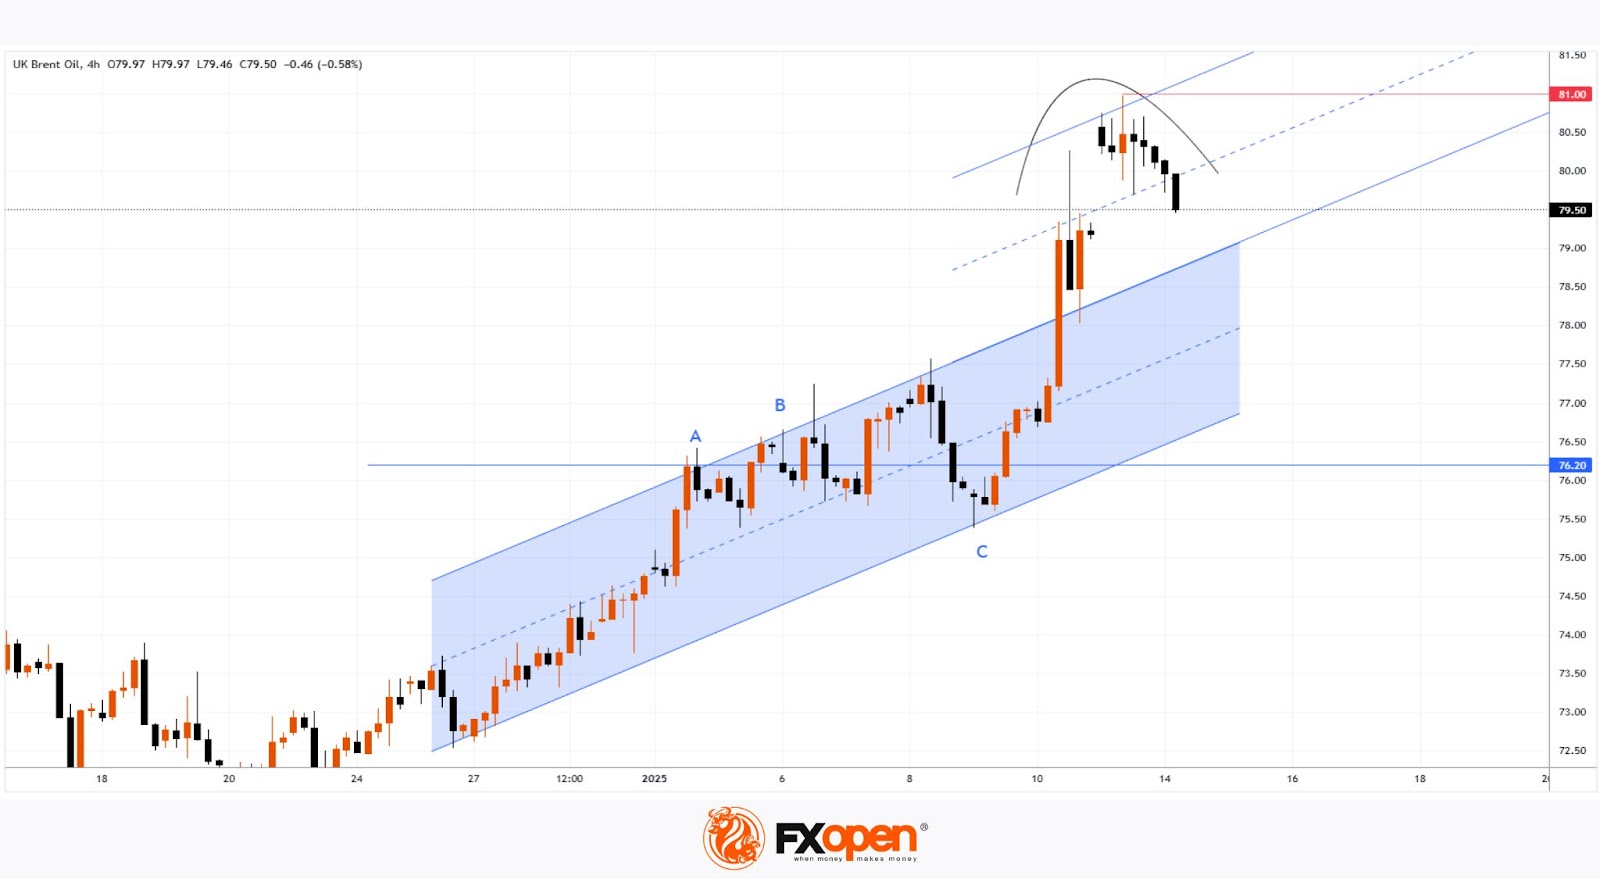
What happened next?
As shown on the XBR/USD chart, Brent oil prices retreated on January 8 to the lower blue line (point C), where bulls successfully resumed the uptrend, pushing the price close to $81—a level last seen in early October 2024, near a key peak (not shown on the chart).
According to The Wall Street Journal:
→ Demand was supported by sanctions imposed by the outgoing Biden administration on Russia’s oil industry.
→ Jonathan Ng, an OCBC Asean economist, noted that the price range of $78–83 appears to be a “relatively comfortable zone” for Brent oil in the near term.
From a technical analysis perspective, the XBR/USD chart displays price action resembling a rounding top pattern. Therefore, it’s possible that after the bullish momentum triggered by the sanctions, another pullback towards the blue channel could occur in the short term.
Going forward, much will depend on the political and trade policies adopted by the incoming Trump administration.
Start trading commodity CFDs with tight spreads (additional fees may apply). Open your trading account now or learn more about trading commodity CFDs with FXOpen.
This article represents the opinion of the Companies operating under the FXOpen brand only. It is not to be construed as an offer, solicitation, or recommendation with respect to products and services provided by the Companies operating under the FXOpen brand, nor is it to be considered financial advice.
Stay ahead of the market!
Subscribe now to our mailing list and receive the latest market news and insights delivered directly to your inbox.


Latest articles

Weekly Market Insights with Gary Thomson: US Inflation, UK GDP, Chair Warsh Testimony, and Earnings
In this video, we’ll explore the key economic events and market trends, shaping the financial landscape. Get ready for insights into financial markets to help you navigate the week ahead. Let’s dive in!
In this episode of Market

GBP/AUD Analysis: The Tug-of-War Begins
Oil is back in the driver's seat, and both the pound and the aussie are feeling its grip. The Bank of England held rates at 3.75% in June, but with UK inflation at 2.8% and crude oil climbing

Australian Dollar Holds Above the Current Market Profile
The minutes from the Reserve Bank of Australia's (RBA) June meeting, released on 30 June, suggested that policymakers are not yet ready to rule out further policy tightening. Board members noted persistent excess demand and broad-based inflationary pressures across the