


BTC/USD Price Analysis: RSI Drops to Lowest Since March 2020
FXOpen

The last time this classic indicator dropped below the 20.0 level was in March 2020, when the world panicked due to the spread of the coronavirus.
The extremely low RSI values indicate an extremely oversold market — it was formed as a result of the collapse of the BTC/USD rate on August 17, the reasons for which are not clear. Among the versions are:
→ SpaceX's decision to sell bitcoins from its balance sheet;
→ high yields of US government bonds (10-year bonds are at a 14-year high);
→ the collapse of the Chinese developer Evergrande.
Be that as it may, the decline of RSI below the level of 20.0 should not be interpreted as a signal to open a long position, although there is evidence for this.
Bullish arguments:
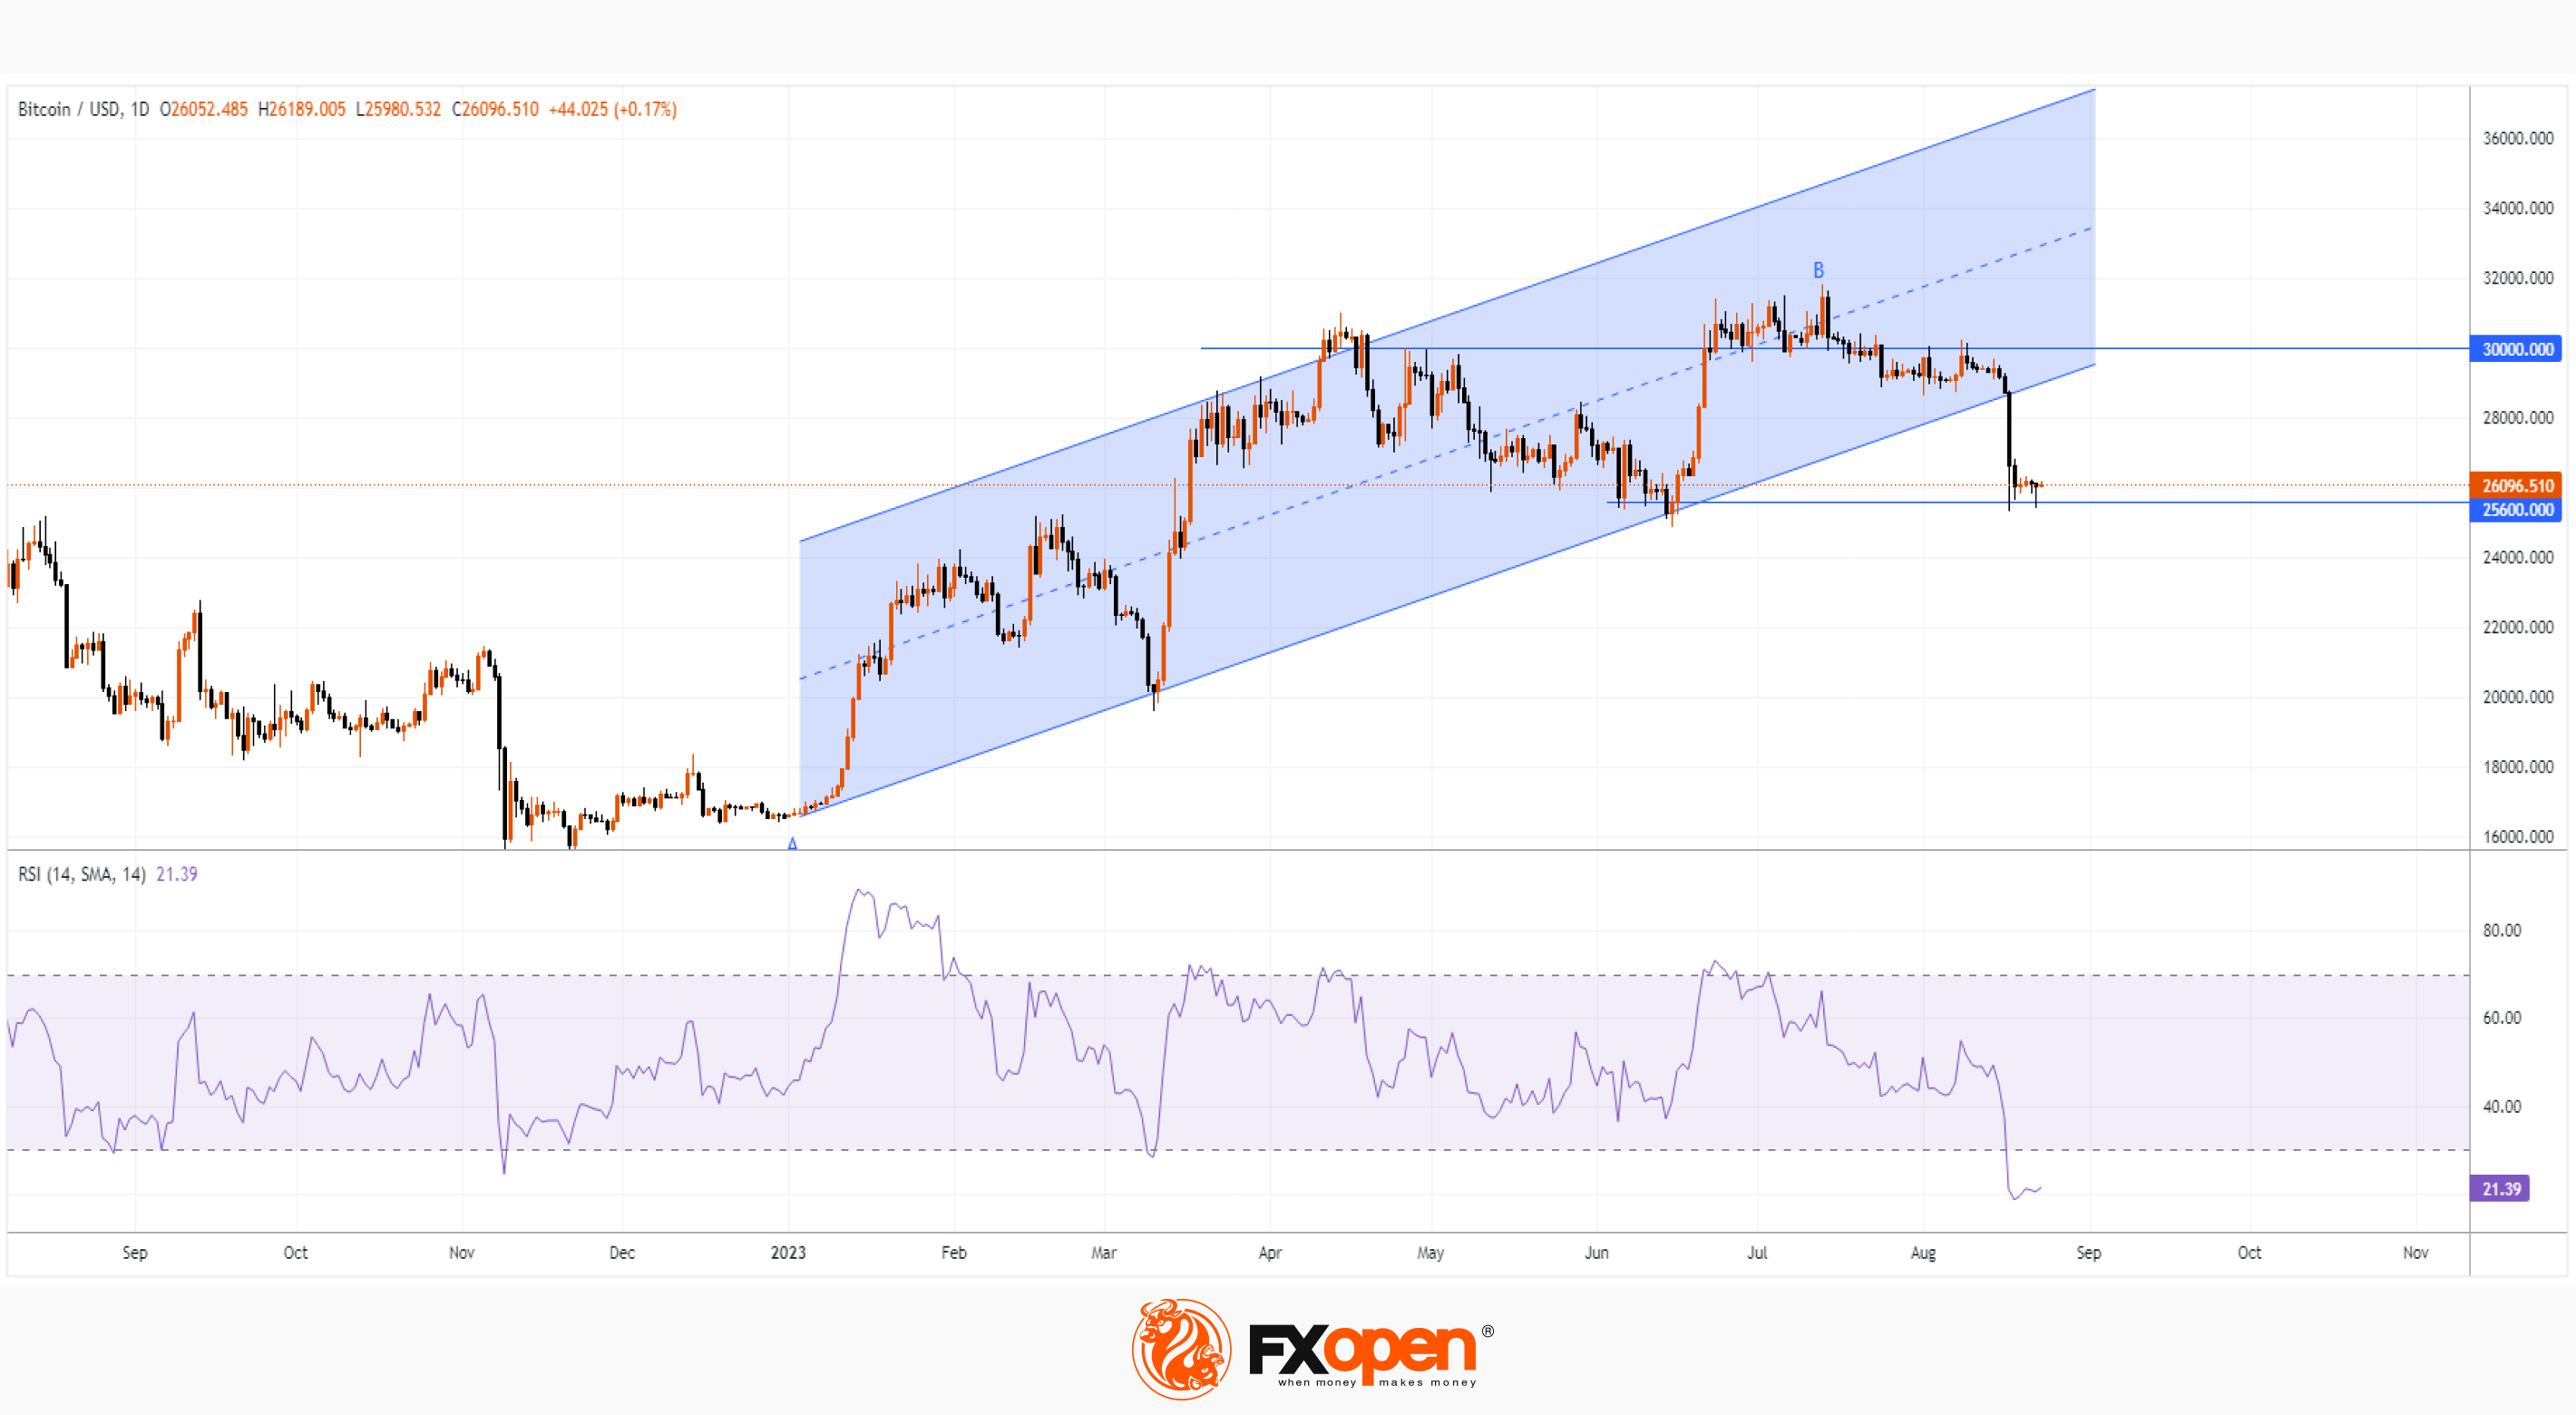
→ a long lower shadow on yesterday's candle on the daily bitcoin price chart confirms the aggressiveness of the bulls defending the 25.6k level;
→ this level approximately coincides with the Fibo level at 0.38 for a rollback from the growth of A→B;
→ the bitcoin market may follow the stock market — after all, the S&P 500 is at the lower boundary of the rising channel, which operates in 2023.
Bearish arguments:
→ The price of bitcoin has broken through the upward channel of 2023, which may mean a radical change in sentiment. The USD 30,000 level proved to be a difficult barrier for the bulls.
→ Intraday charts show that bitcoin fell especially rapidly in the 26,800-27,500 range. Therefore, this area of seller dominance could become resistance to a recovery if it follows the RSI's spring 2020 lows.
FXOpen offers the world's most popular cryptocurrency CFDs*, including Bitcoin and Ethereum. Floating spreads, 1:2 leverage — at your service (additional fees may apply). Open your trading account now or learn more about crypto CFD trading with FXOpen.
*Important: At FXOpen UK, Cryptocurrency trading via CFDs is only available to our Professional clients. They are not available for trading by Retail clients. To find out more information about how this may affect you, please get in touch with our team.
This article represents the opinion of the Companies operating under the FXOpen brand only. It is not to be construed as an offer, solicitation, or recommendation with respect to products and services provided by the Companies operating under the FXOpen brand, nor is it to be considered financial advice.
Stay ahead of the market!
Subscribe now to our mailing list and receive the latest market news and insights delivered directly to your inbox.


Latest articles

AUD/CAD: Months of Indecision — Is a Breakout Finally Coming?
The Australian dollar has clawed back most of its end-of-June losses, when it touched three-month lows against the greenback amid escalating Middle East tensions. Since then, sentiment has improved: the RBA's Assistant Governor Sarah Hunter signalled the board stands ready

USD/JPY: Battling at the Top of the Triangle
On 3 July, Japan's Finance Minister, Satsuki Katayama, stated that the Ministry of Finance remains in close contact with US authorities regarding developments in USD/JPY as the yen traded near its weakest level in almost 40 years. Similar verbal

Dow Jones (DJIA): Consolidation Beyond the Trend
Federal Reserve Chair Kevin Warsh testified before Congress on 14–15 July, reaffirming the Fed's commitment to bringing inflation back to target while providing no clear guidance on the future path of interest rates. Meanwhile, June inflation data came in