


GOOG Stock Sets Historic Record
FXOpen

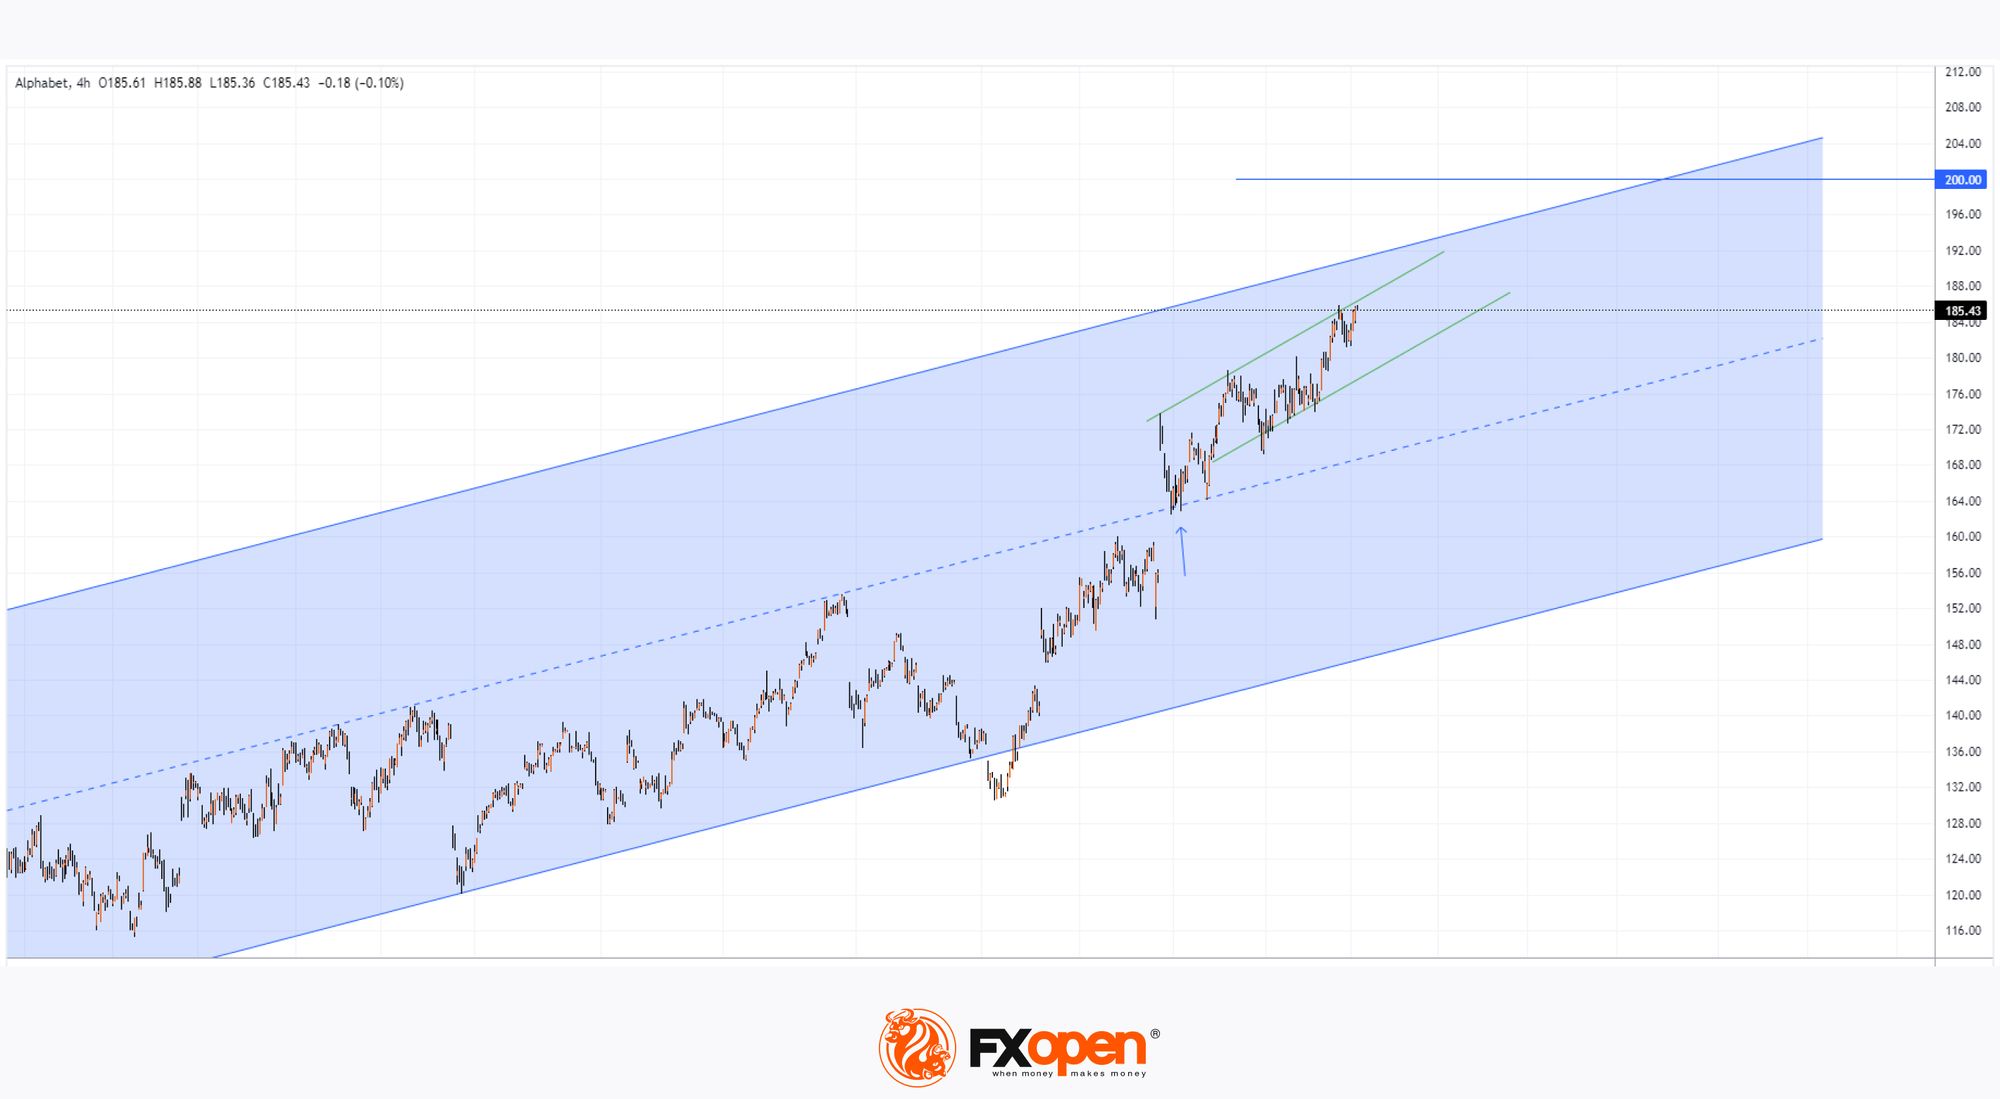
As the chart shows, the GOOG stock price yesterday surpassed the June 27th high and set a historic record at $185.88.
What contributed to this?
→ Overall bullish sentiment in the US stock market. Incidentally, the S&P 500 index (US SPX 500 mini on FXOpen) also set a historic record yesterday;
→ Positive market expectations ahead of the second-quarter earnings report from Alphabet (Google's parent company);
→ Benzinga reports positive prospects, particularly highlighting the development of YouTube and language models.
Out of 38 analysts surveyed by TipRanks, 32 recommend buying Google stock. The average price forecast is $199 in 12 months.
But why then is Alphabet CEO Sundar Pichai selling over $4 million worth of company shares? According to the Form 4 filed with the SEC, Sundar sold a total of 22,500 shares.
Today's technical analysis of the GOOG chart shows that:
→ The price is moving in an uptrend (shown in blue), which began in 2023.
→ The price, with a bullish gap, "burst" into the upper half of the channel, then tested the median (indicated by an arrow) and entered a steeper uptrend, shown by the green lines.
If the bullish trend continues, the price may find resistance at the upper boundary of the blue channel on its way to the psychological level of $200.
Current sentiments could be influenced by the second-quarter earnings report (scheduled for release on June 23rd). If the report is disappointing, the GOOG price may fall to the median – which could provide another clue as to why the company's head sold shares.
Buy and sell stocks of the world's biggest publicly-listed companies with CFDs on FXOpen’s trading platform. Open your FXOpen account now or learn more about trading share CFDs with FXOpen.
This article represents the opinion of the Companies operating under the FXOpen brand only. It is not to be construed as an offer, solicitation, or recommendation with respect to products and services provided by the Companies operating under the FXOpen brand, nor is it to be considered financial advice.
Stay ahead of the market!
Subscribe now to our mailing list and receive the latest market news and insights delivered directly to your inbox.


Latest articles

AI Valuations Are Back in the Spotlight
Artificial intelligence remains the dominant investment theme of 2026, but investors are increasingly questioning whether AI stock valuations are keeping pace with reality.
💰 Big Tech continues to invest at an unprecedented scale, with hyperscaler AI spending projected to exceed $800

AUD/CAD: Months of Indecision — Is a Breakout Finally Coming?
The Australian dollar has clawed back most of its end-of-June losses, when it touched three-month lows against the greenback amid escalating Middle East tensions. Since then, sentiment has improved: the RBA's Assistant Governor Sarah Hunter signalled the board stands ready

USD/JPY: Battling at the Top of the Triangle
On 3 July, Japan's Finance Minister, Satsuki Katayama, stated that the Ministry of Finance remains in close contact with US authorities regarding developments in USD/JPY as the yen traded near its weakest level in almost 40 years. Similar verbal