


FXOpen

On July 11, the Nikkei 225 index (Japan 225 on FXOpen) started to decline. Notably, on July 15, we observed bearish activity around the 41330 level.
Interestingly, US stock indices also began to fall on July 11. However, the Japanese stock market saw a more dramatic drop, exceeding 25% by the August 5 low.
Has the Japanese stock market continued to fall? No. After a alarming Monday on August 5, the price has been recovering. It closed higher on Tuesday and Wednesday, with bullish signs observed today, Thursday.
Analyzing the Nikkei 225 (Japan 225 on FXOpen) chart on Monday, we noted that:
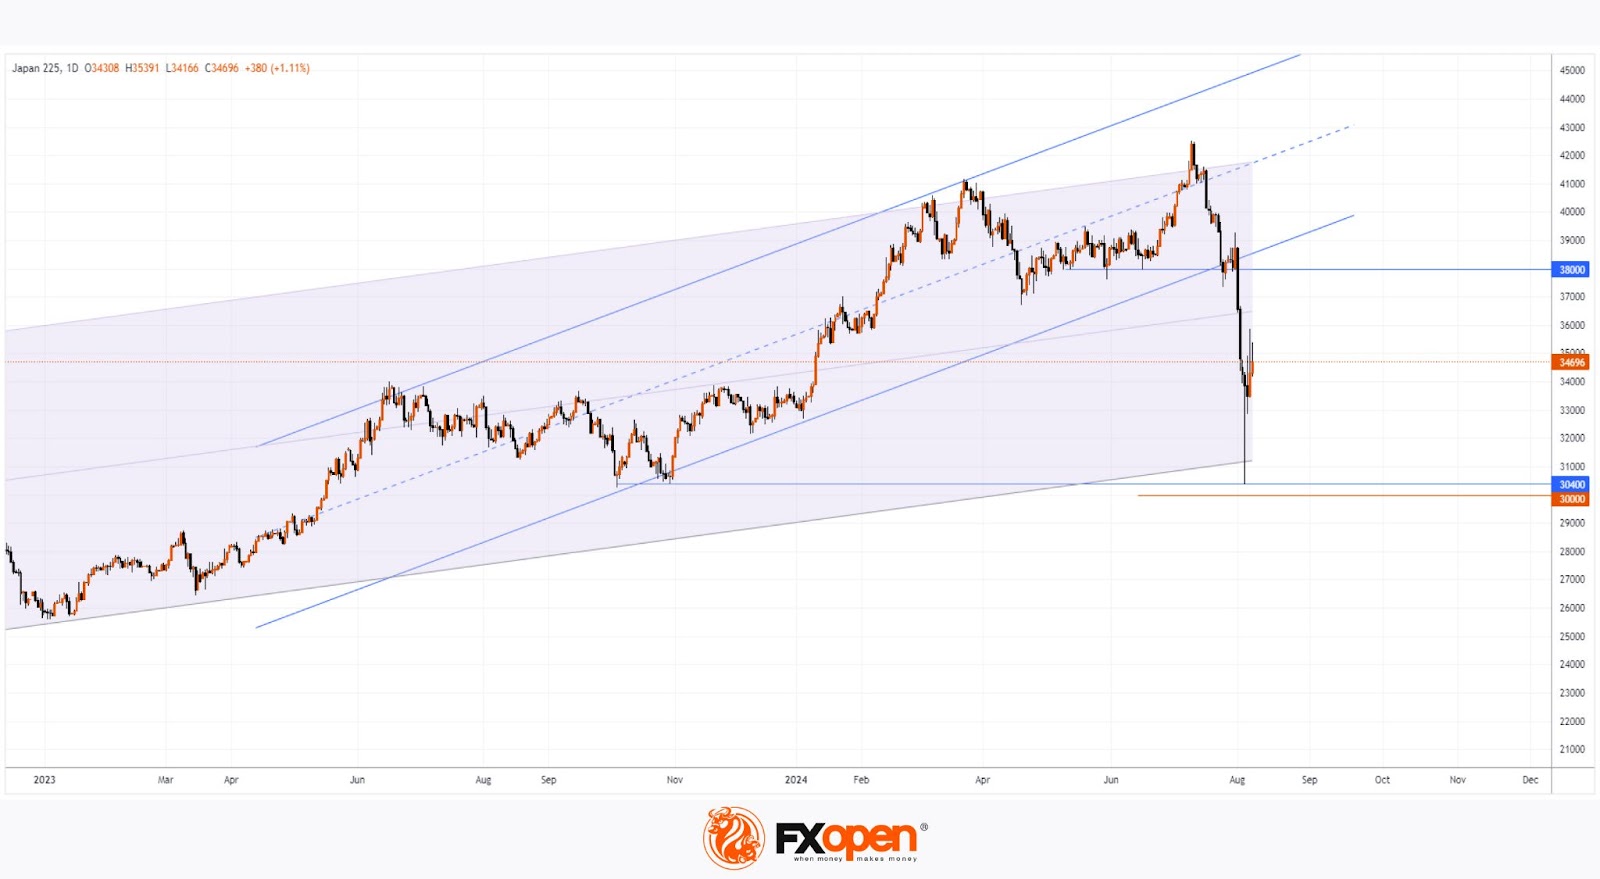
→ The price dropped to a support block between 30,400 and the psychological level of 30k.
→ A strong bounce from this block could indicate activated demand (a sign of an emotional selling climax in Wyckoff's terminology).
We then suggested that this support block would hold, and the Japanese stock market might enter a consolidation phase to establish a new balance of supply and demand.
Today, the technical analysis of the Nikkei 225 (Japan 225 on FXOpen) chart shows:
→ The price has risen from the support block around 30,400 and is currently near 35,000.
→ Notably, the price found support at the lower boundary of the linear regression channel, indicating deviations from average values (shown in light purple). The lower boundary acted as support.
→ The price is below 38,000, where previous supports, including the lower boundary of a significant ascending channel (shown with blue lines), were breached. These are now expected to act as resistance.
Thus, after an extremely volatile Monday, the market may continue to develop a consolidation phase with decreasing amplitude, within the range of 30k to 38k. This phase will help establish a clearer consensus on the fair valuation of the Japanese stock market, considering the Bank of Japan's rate hike last week and the risks of a US recession.
Trade global index CFDs with zero commission and tight spreads (additional fees may apply). Open your FXOpen account now or learn more about trading index CFDs with FXOpen.
This article represents the opinion of the Companies operating under the FXOpen brand only. It is not to be construed as an offer, solicitation, or recommendation with respect to products and services provided by the Companies operating under the FXOpen brand, nor is it to be considered financial advice.
Stay ahead of the market!
Subscribe now to our mailing list and receive the latest market news and insights delivered directly to your inbox.


Latest articles

Market Analysis: GBP/USD Dips Further As EUR/GBP Regains Traction
GBP/USD failed to climb above 1.3500 and corrected some gains. EUR/GBP started a decent increase and might aim for more gains above 0.8700.
Important Takeaways for GBP/USD and EUR/GBP Analysis Today
· The British Pound


Market Insights with Gary Thomson: Oil, US Retail Sales & NFP in Focus
In this video, we’ll explore the key economic events and market trends, shaping the financial landscape. Get ready for insights into financial markets to help you navigate the week ahead. Let’s dive in!
In this episode of Market