


FXOpen
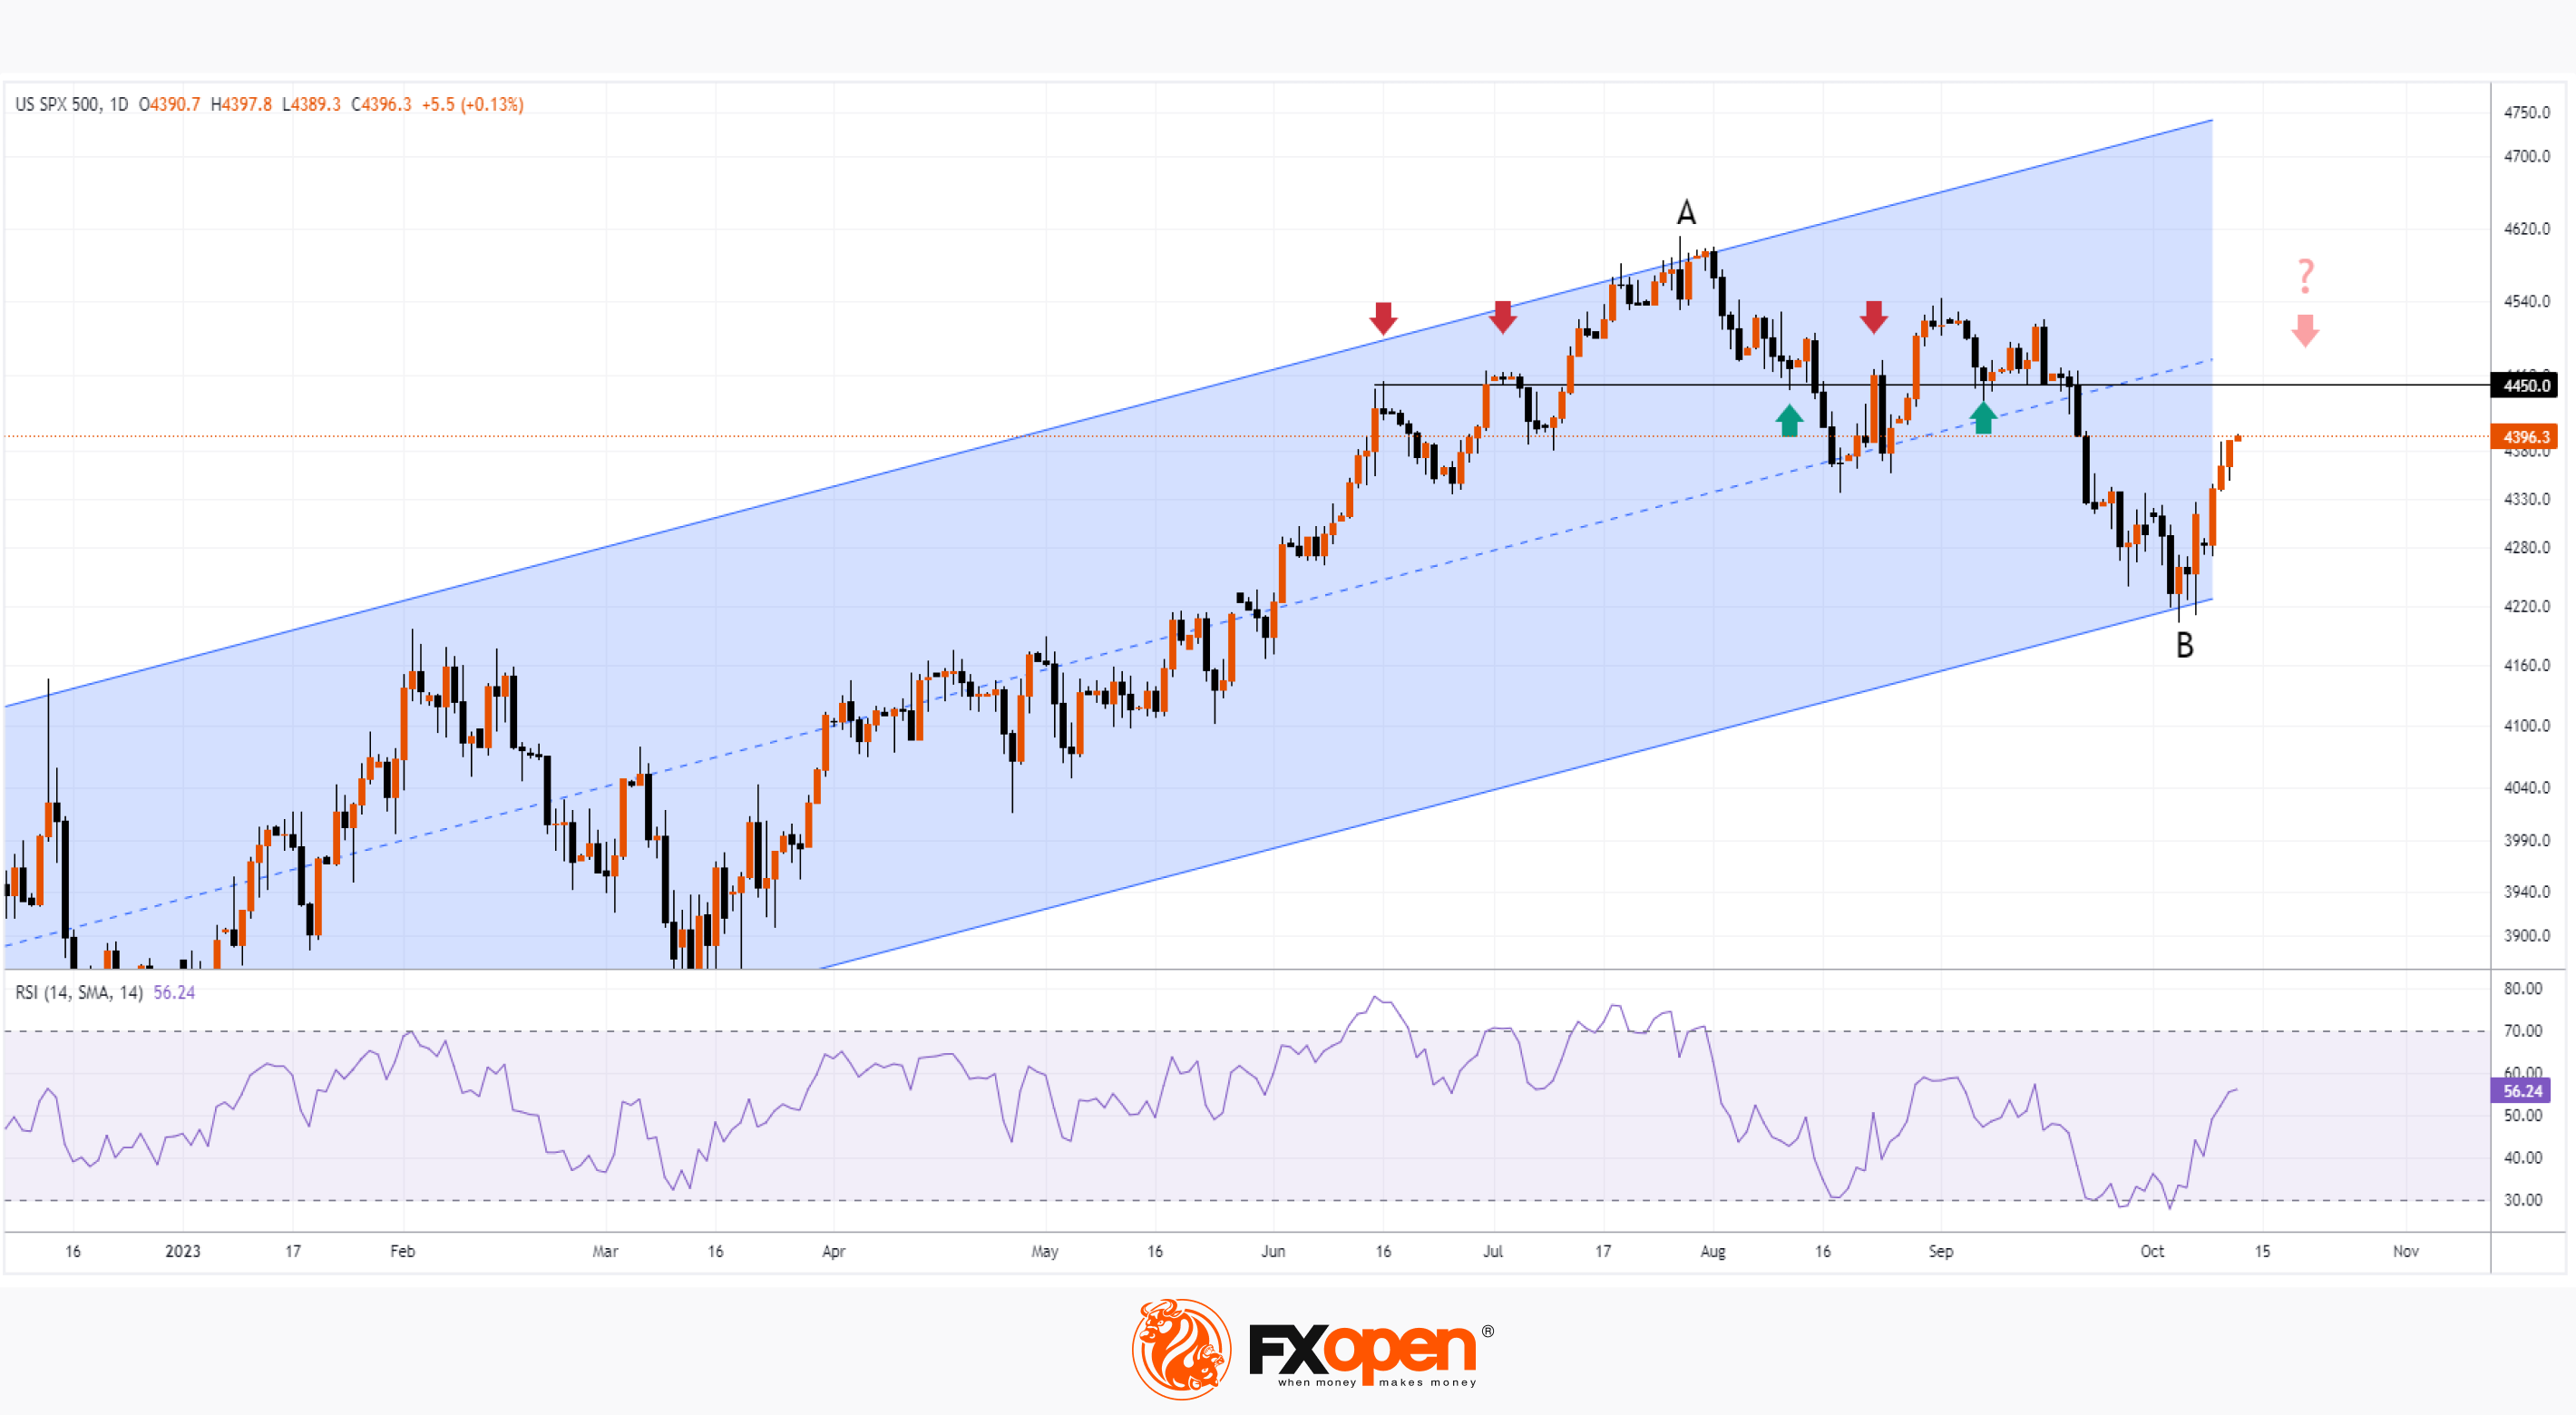
As we wrote in our October 8 market analysis, the S&P 500 chart made bullish arguments, including:
→ the S&P 500 price has reached the lower boundary of the ascending channel (shown in blue);
→ RSI fell to its minimum in 12 months.
Technically, these factors were justified, because today, the S&P 500 has strengthened, the price is near the psychological level of 4,400. Yesterday’s news also contributed to this:
→ inflation suddenly accelerated. The Producer Price Index (PPI) was 0.5%, although 0.3% was expected. The acceleration of inflation was influenced by the September peak in the oil market. But with the price of oil already back more than 10% from its peak, traders are not expected to be too worried about the PPI rise;
→ a "majority" of Fed officials thought another rate hike would "likely be appropriate" to help cool demand and bring inflation closer to its 2% inflation target over the next two years, while "some" said “no". “Participants generally noted that it was important to balance the risk of overtightening against the risk of insufficient tightening,” the minutes said.
As a result, as of Thursday morning, the price of the S&P 500 is at a high of the week, which indicates that, according to the consolidated view, the Fed is in control of the fight against inflation in a market that is experiencing positivity ahead of the reporting season.
Corporate performance will weigh heavily on the S&P 500 price in the coming weeks, with bullish momentum forming a rebound from the lower boundary of the ascending channel likely to be hampered by:
→ psychological level 4400, in the area of which Fibo 50% of the decline in A→B occurs;
→ level 4,450 – as the arrows show, it has affected the price more than once since June 2022.
Trade global index CFDs with zero commission and tight spreads (additional fees may apply). Open your FXOpen account now or learn more about trading index CFDs with FXOpen.
This article represents the opinion of the Companies operating under the FXOpen brand only. It is not to be construed as an offer, solicitation, or recommendation with respect to products and services provided by the Companies operating under the FXOpen brand, nor is it to be considered financial advice.
Stay ahead of the market!
Subscribe now to our mailing list and receive the latest market news and insights delivered directly to your inbox.


Latest articles


XAG/USD Analysis: Silver Drops to March Low
As seen on the XAG/USD chart, the price of silver fell to the $70 level and briefly pierced it, marking the lowest level since early February.
Although geopolitical tensions typically support demand for safe-haven assets, silver is under pressure

XBR/USD Analysis: Brent Crude Rises Above $110
Yesterday, Brent crude prices moved sharply higher, with the XBR/USD chart showing breakouts above local resistance levels. Today, the price has climbed above the $110 mark, bringing it close to the multi-year high recorded on 9 March.
The bullish