


FXOpen

According to statistics since 1971, when the Nasdaq Index was created, the index price has been within the bullish trend approximately 75% of the days and 25% of the days within the bearish trend. But what’s interesting is that if you take the 100 largest bullish candles during this time, then 80% of them will occur during those periods when the market was in a bearish trend. A similar pattern can be observed for the S&P 500 index, which has a deeper history.
It turns out that the strongest one-day rallies occur during downturns — why is that so? The reasons may be:
→ emotions of market participants who strive to take long positions at the very beginning of the rally;
→ properties of bear markets, which are inherently more volatile than bull markets.
How does this relate to the current situation?
Of course, it is difficult to call the current market bearish. However, the MarketWatch article may be relevant due to the signals of weakness that the chart shows:
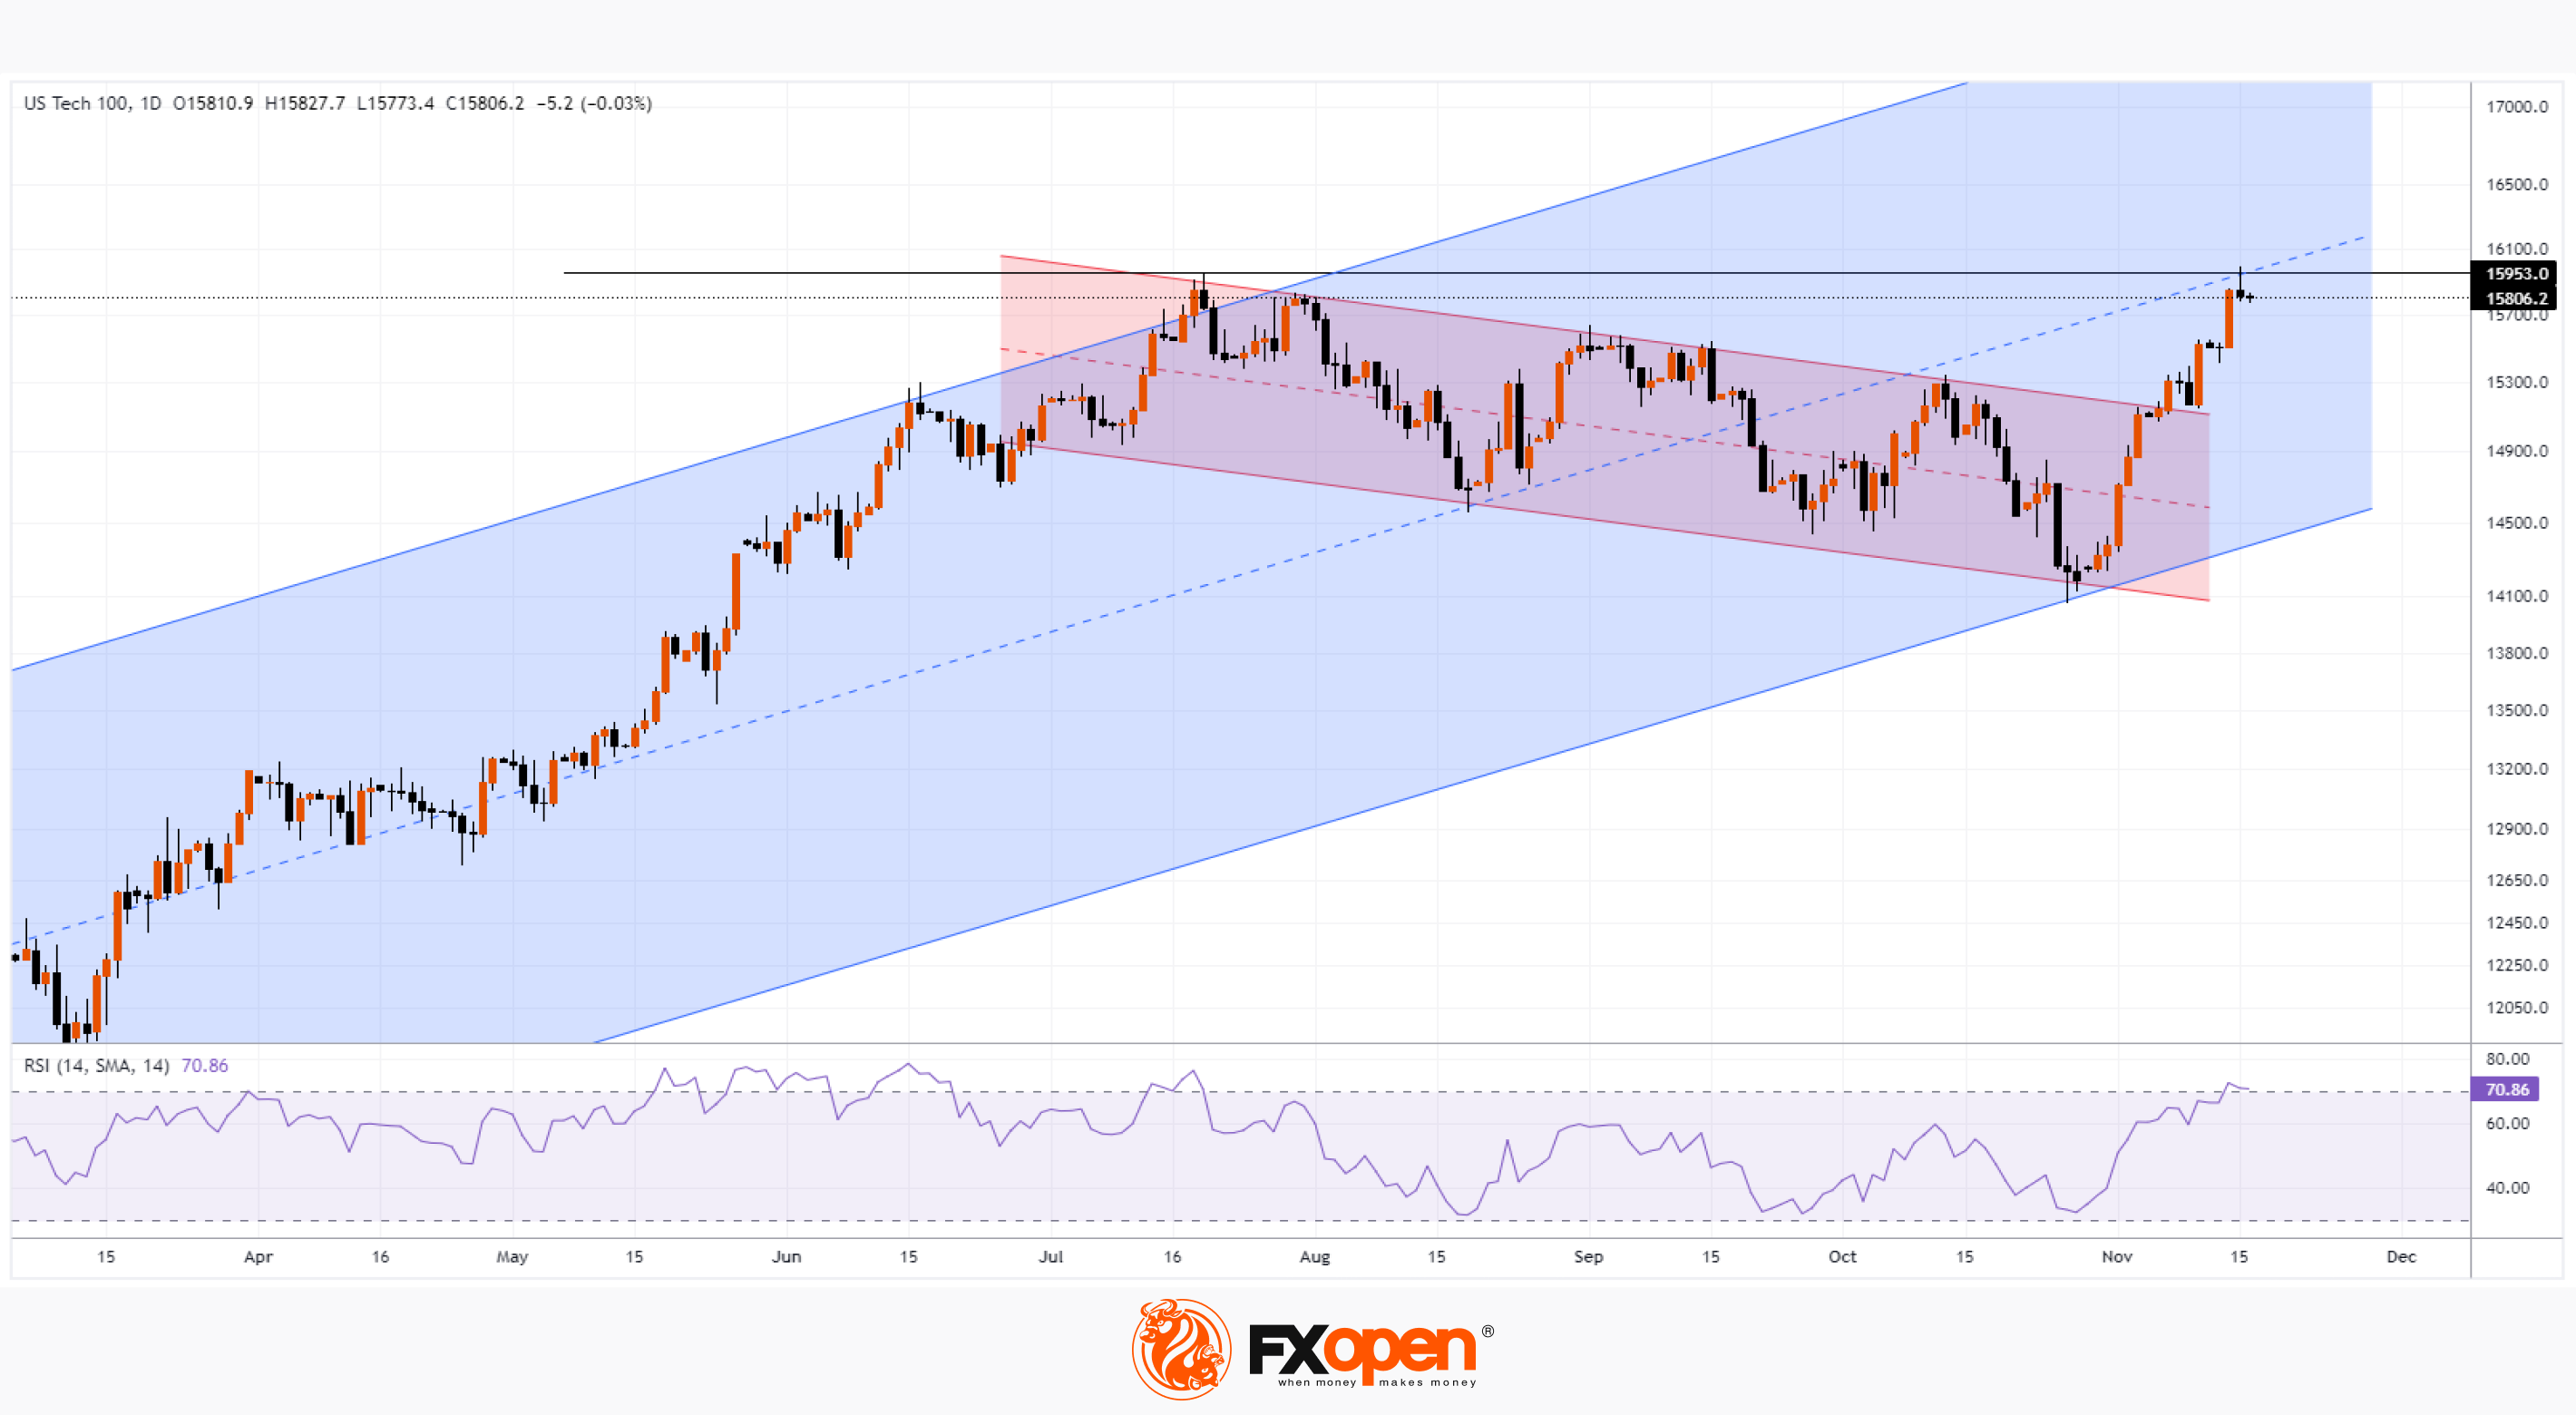
→ On Tuesday, there was a sharp rally against the backdrop of the release of favourable news about inflation. At the same time, the price moved away from the downward red correction channel, which was drawn within the current upward trend of 2023;
→ yesterday, as the chart shows, the index set the maximum of the year in the area of 15953 — but at the same time, the shape of the candle shows that the bears were active: since the candle closed at the lows with a long upper tail;
→ the price tested the median line of the ascending blue channel from bottom to top – it showed itself as resistance;
→ the RSI indicator entered the overbought zone for the first time since July.
The listed facts can be considered arguments to expect a correction in the index price after a noticeable increase from the lows set at the end of October.
Trade global index CFDs with zero commission and tight spreads. Open your FXOpen account now or learn more about trading index CFDs with FXOpen.
This article represents the opinion of the Companies operating under the FXOpen brand only. It is not to be construed as an offer, solicitation, or recommendation with respect to products and services provided by the Companies operating under the FXOpen brand, nor is it to be considered financial advice.
Stay ahead of the market!
Subscribe now to our mailing list and receive the latest market news and insights delivered directly to your inbox.


Latest articles

Natural Gas Prices Fell in Late December
On 4 December, while analysing the XNG/USD chart, we highlighted the rally in natural gas prices towards a three-year high and noted that the price had entered a resistance zone formed by:
→ the upper boundary of a broad descending


Gold Price Analysis: Price Retreats From Record Highs
As the XAU/USD chart shows, gold rallied yesterday to near its October all-time high around the 4,380 level, before pulling back (as indicated by the arrow).
The surge in volatility was driven by a combination of factors:
→ Expectations