


Market Analysis: The Price of Bitcoin Updates the Maximum of the Year, What's Next?
FXOpen

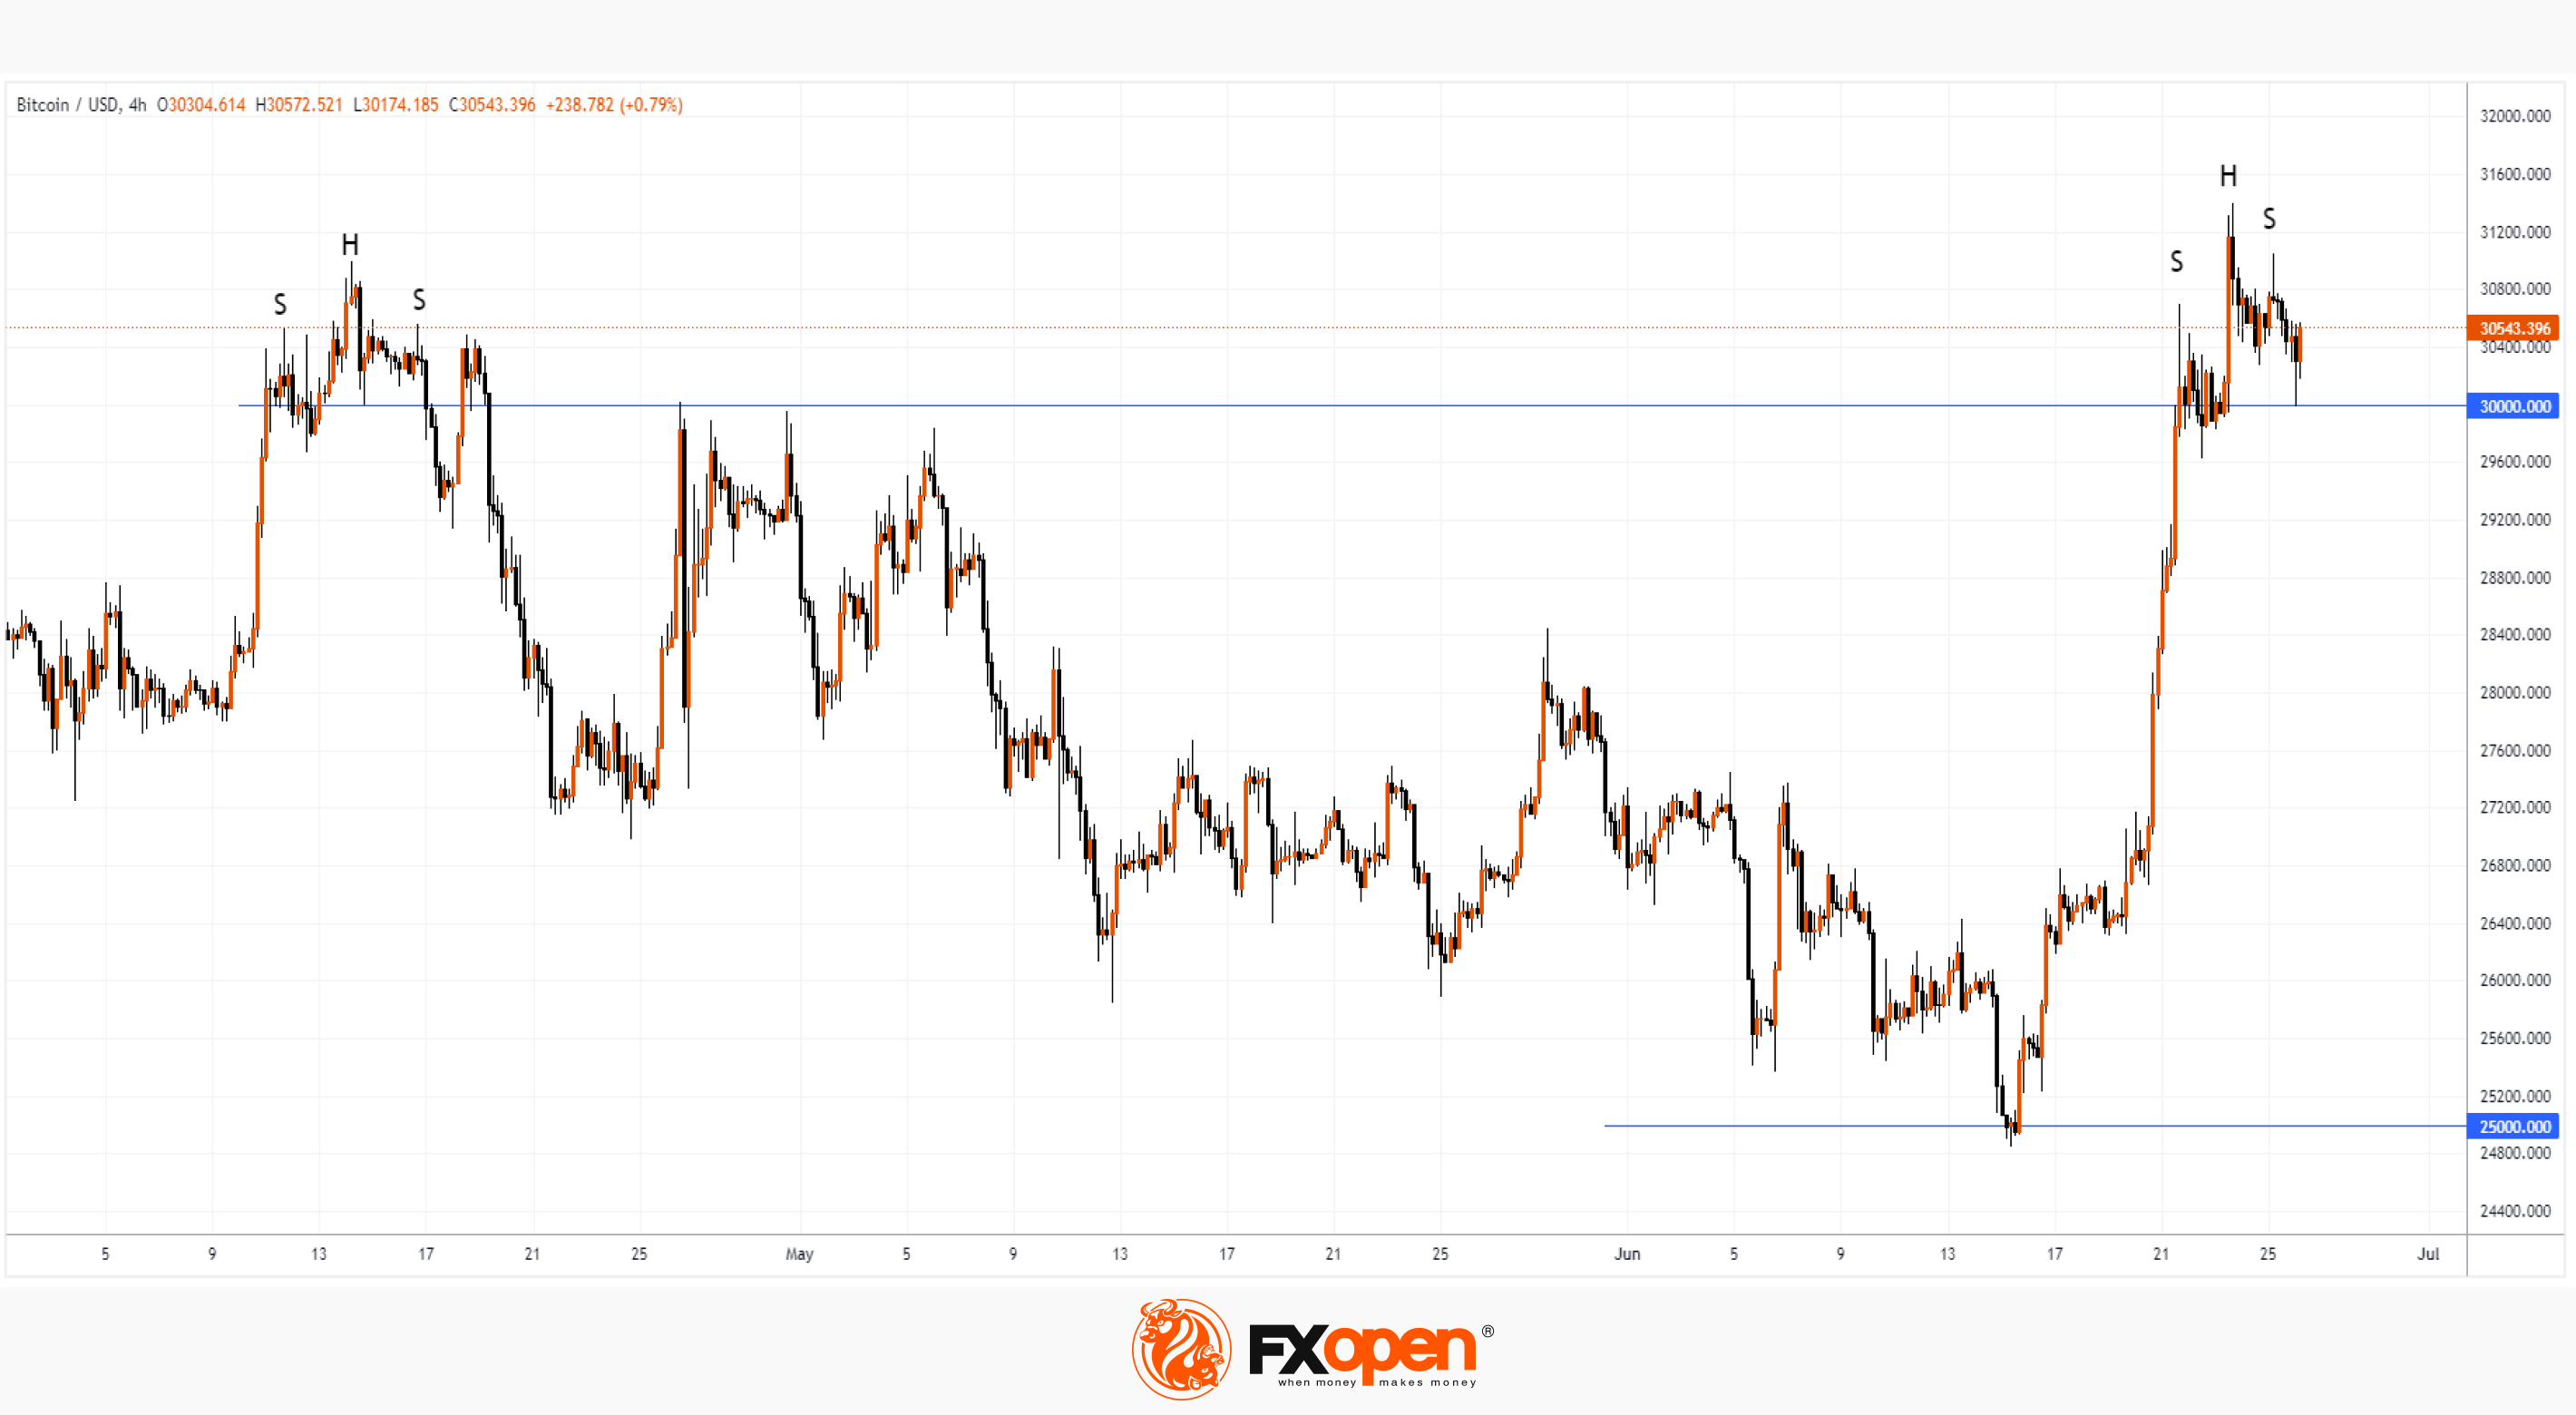
After skyrocketing last week for the 3 reasons we wrote about earlier, the price of bitcoin hit a 2023 high on Friday, surpassing USD 31,400 per bitcoin. This was facilitated by the news that the SEC approved the first exchange-traded fund (ETF) of bitcoin futures with leverage.
In April, the bulls were already above the psychological level of USD 30k per bitcoin, but after that a pullback followed, culminating in the price dropping below the psychological level of USD 25k per bitcoin. The BTC/USD market once again emphasized the emotionality of its participants — this is how you can interpret the tendency of the bitcoin exchange rate to the US dollar to make reversals after the breakdown of psychological levels.
What will happen next? Will the price of bitcoin follow the June breakdown according to the rollback scenario that was realized after the April breakdown? The probability of this is indicated by the bearish SHS patterns (head-and-shoulders), which formed when the price of bitcoin exceeded the level of 30k. You may also have deja vu, as the 2 peaks above 30k in 2023 resemble the 2 peaks (in April and November) above 60k in 2021.
The ability of the price of bitcoin to recover from declines under the 30k level (if any) will give more evidence that the bull market is indeed sustainable.
FXOpen offers the world's most popular cryptocurrency CFDs*, including Bitcoin and Ethereum. Floating spreads, 1:2 leverage — at your service (additional fees may apply). Open your trading account now or learn more about crypto CFD trading with FXOpen.
*Important: At FXOpen UK, Cryptocurrency trading via CFDs is only available to our Professional clients. They are not available for trading by Retail clients. To find out more information about how this may affect you, please get in touch with our team.
This article represents the opinion of the Companies operating under the FXOpen brand only. It is not to be construed as an offer, solicitation, or recommendation with respect to products and services provided by the Companies operating under the FXOpen brand, nor is it to be considered financial advice.
Stay ahead of the market!
Subscribe now to our mailing list and receive the latest market news and insights delivered directly to your inbox.


Latest articles

Weekly Market Insights with Gary Thomson: The Week of Central Banks and Earnings
In this video, we’ll explore the key economic events and market trends, shaping the financial landscape. Get ready for insights into financial markets to help you navigate the week ahead. Let’s dive in!
In this episode of Market

Intel at a Crossroads: Earnings Beat Meets Technical Resistance
Intel has just delivered its strongest quarter in over fifteen years, and the market reaction says it all. Q2 2026 revenue surged 25% year-over-year to $16.1 billion, crushing the consensus estimate of $14.42 billion, while adjusted EPS of

Tesla: Complex Range Structure Breaks Down Following Quarterly Earnings
Tesla released its Q2 2026 results after the market closed on 22 July. Revenue increased 26% year-on-year to $28.24 billion, while vehicle deliveries reached a record 480,126 units. However, operating margin fell sharply to 1.4%, down from