


FXOpen

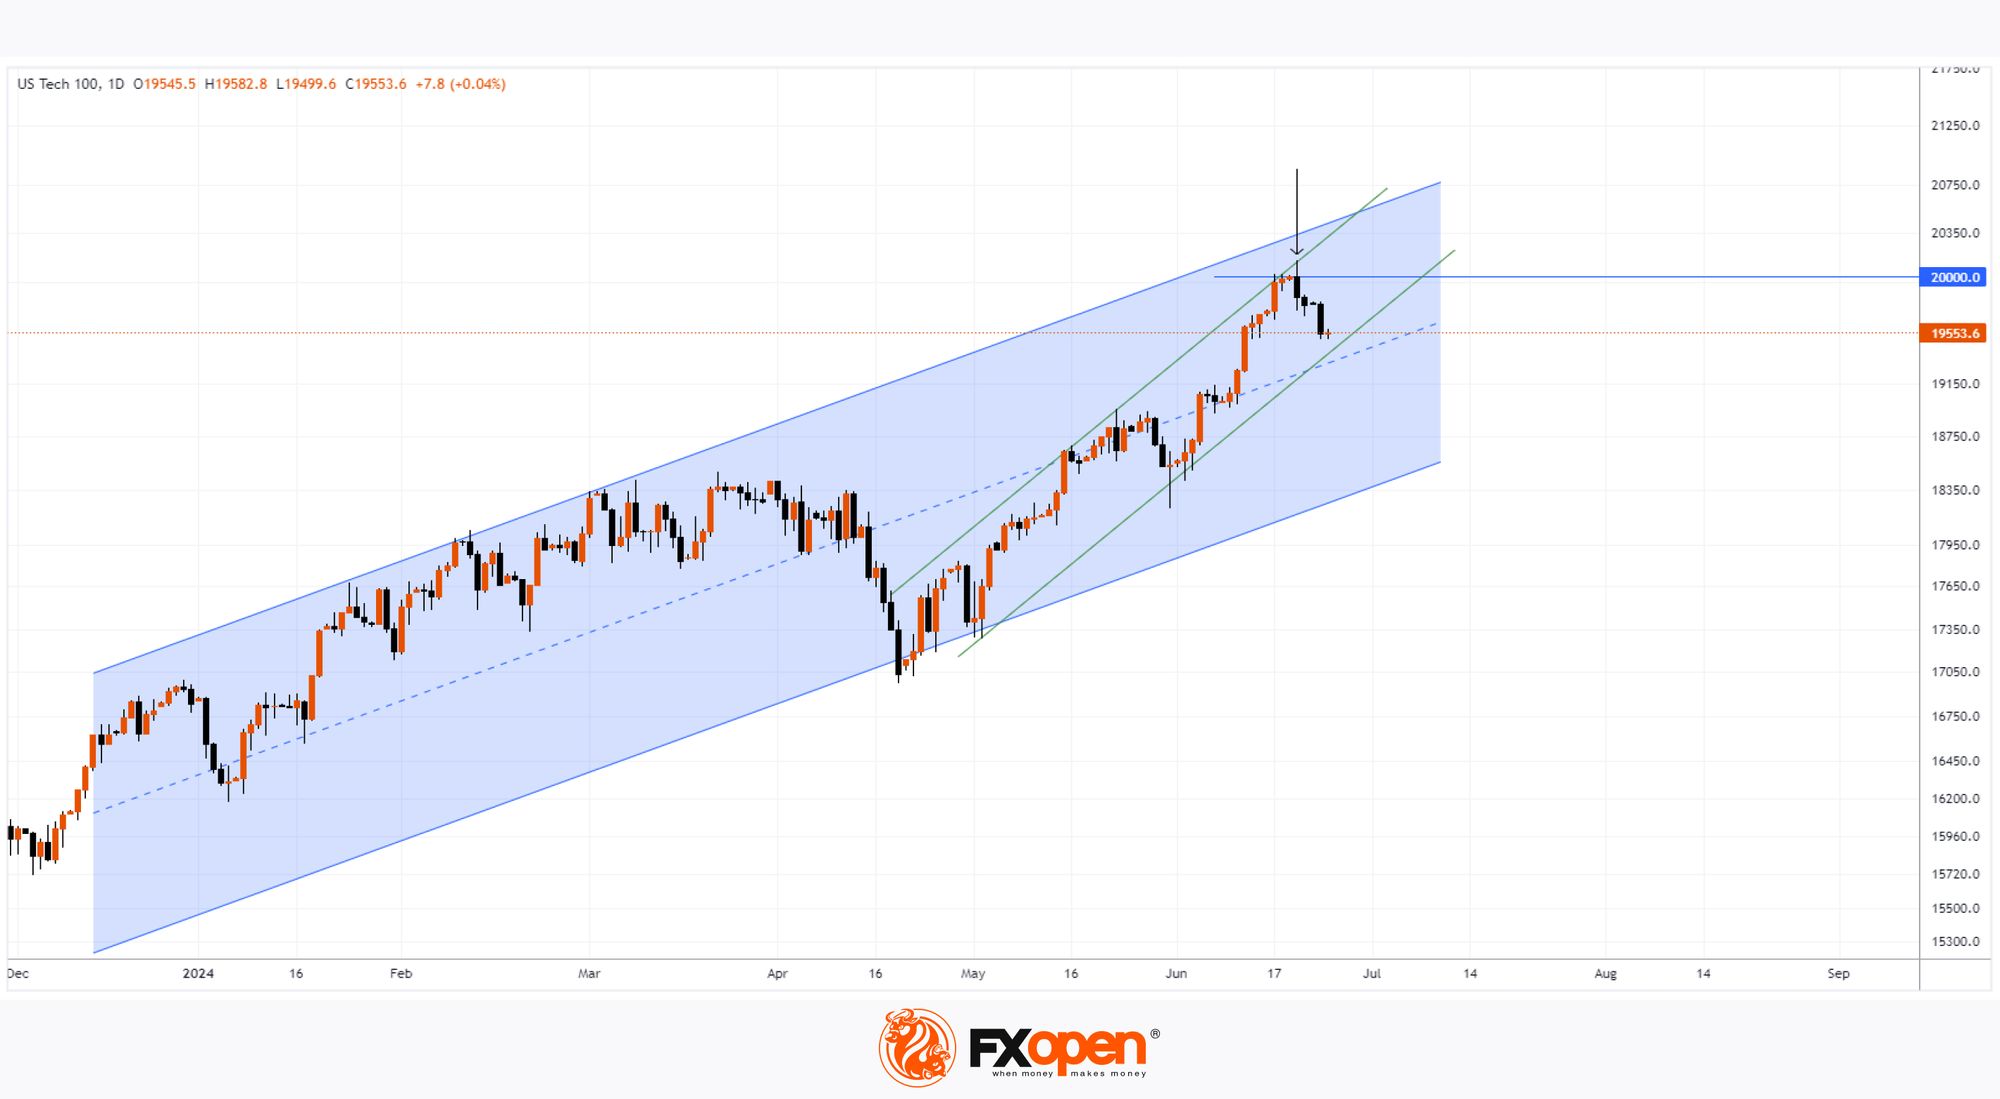
On 18th June, we reported that the Nasdaq 100 (US Tech 100 mini on FXOpen) market had recorded a historic high by surpassing the psychological level of 20,000.
At that time, we pointed to the upper line of the ascending channel (shown in green), which has been in place since 19th April, as a potential resistance level.
About a week has passed, and the Nasdaq 100 (US Tech 100 mini on FXOpen) chart indicates that the price failed to hold above the psychological level and turned downwards from the upper green line.
One of the drivers of the decline was NVDA shares, which fell by approximately 15% over three trading sessions.
Meanwhile, Bloomberg quotes Buff Dormeier, Chief Technical Analyst at Kingsview Partners, stating that Nvidia’s share price decline occurred following potentially bullish news:
→ a stock split, making the shares more accessible to a wider range of retail investors;
→ attaining the status of the company with the largest market capitalisation (a status now lost);
→ strong fundamental data related to the company's leadership in the AI-related industry. By some estimates, the company controls about 80% of the chip market needed for AI model development.
Bearish behaviour of NVDA’s price amidst bullish news is a bearish sign.
Technical analysis of the Nasdaq 100 (US Tech 100 mini on FXOpen) chart gives further cause for concern:
→ the price failed to reach the upper boundary of the long-term blue channel (shown in blue);
→ according to Nasdaq data on 20th June (this day is marked with an arrow), approximately 890 thousand E-mini futures contracts were traded on the derivatives market – the highest volume since 19th April (when an important low was recorded).
High volumes are a sign of large player activity, who may use the surge in demand caused by good news to close their substantial long positions. The thesis of large seller activation is confirmed by:
→ a candlestick with a long upper shadow formed on the chart on 20th June;
→ the Nasdaq 100 (US Tech 100 mini on FXOpen) index price continued to decline on 21st and 24th June.
Therefore, it is reasonable to conclude that the bears have revealed their presence on the chart. If weak attempts by bulls to resume the upward trend with a hold above the psychological level of 20,000 (e.g., with a rebound from the median line) appear on the chart in the near future, this could provoke more aggressive behaviour from the bears.
Trade global index CFDs with zero commission and tight spreads (additional fees may apply). Open your FXOpen account now or learn more about trading index CFDs with FXOpen.
This article represents the opinion of the Companies operating under the FXOpen brand only. It is not to be construed as an offer, solicitation, or recommendation with respect to products and services provided by the Companies operating under the FXOpen brand, nor is it to be considered financial advice.
Stay ahead of the market!
Subscribe now to our mailing list and receive the latest market news and insights delivered directly to your inbox.


Latest articles

European Currencies Decline: Pound Hits New Lows, Euro Under Pressure
European currencies continue to weaken against the US dollar amid rising geopolitical tensions and increased demand for safe-haven and liquid assets. Market participants are reducing exposure to riskier instruments, putting pressure on both the euro and the pound. Additional support

Market Analysis: GBP/USD Dips Further As EUR/GBP Regains Traction
GBP/USD failed to climb above 1.3500 and corrected some gains. EUR/GBP started a decent increase and might aim for more gains above 0.8700.
Important Takeaways for GBP/USD and EUR/GBP Analysis Today
· The British Pound
