


Nvidia (NVDA) Stock Price Falls to a Two-Month Low
FXOpen

While the Nasdaq 100 index (US Tech 100 mini on FXOpen) climbed to an all-time high, Nvidia's (NVDA) stock price dropped below $131 during yesterday's trading session for the first time since mid-October. This bearish behaviour suggests a weakening of Nvidia's leading position. What is the reason?
A key driver could be the significant surge in Broadcom Inc. (AVGO) shares, a competitor to Nvidia. Following a roughly 20% price increase for AVGO in one day, another growth day followed, as we anticipated yesterday. As a result, amid Broadcom's strong forecast for 2025, AVGO shares have risen by 54% since early December, and investors may be reallocating their portfolios, selling NVDA and buying AVGO.
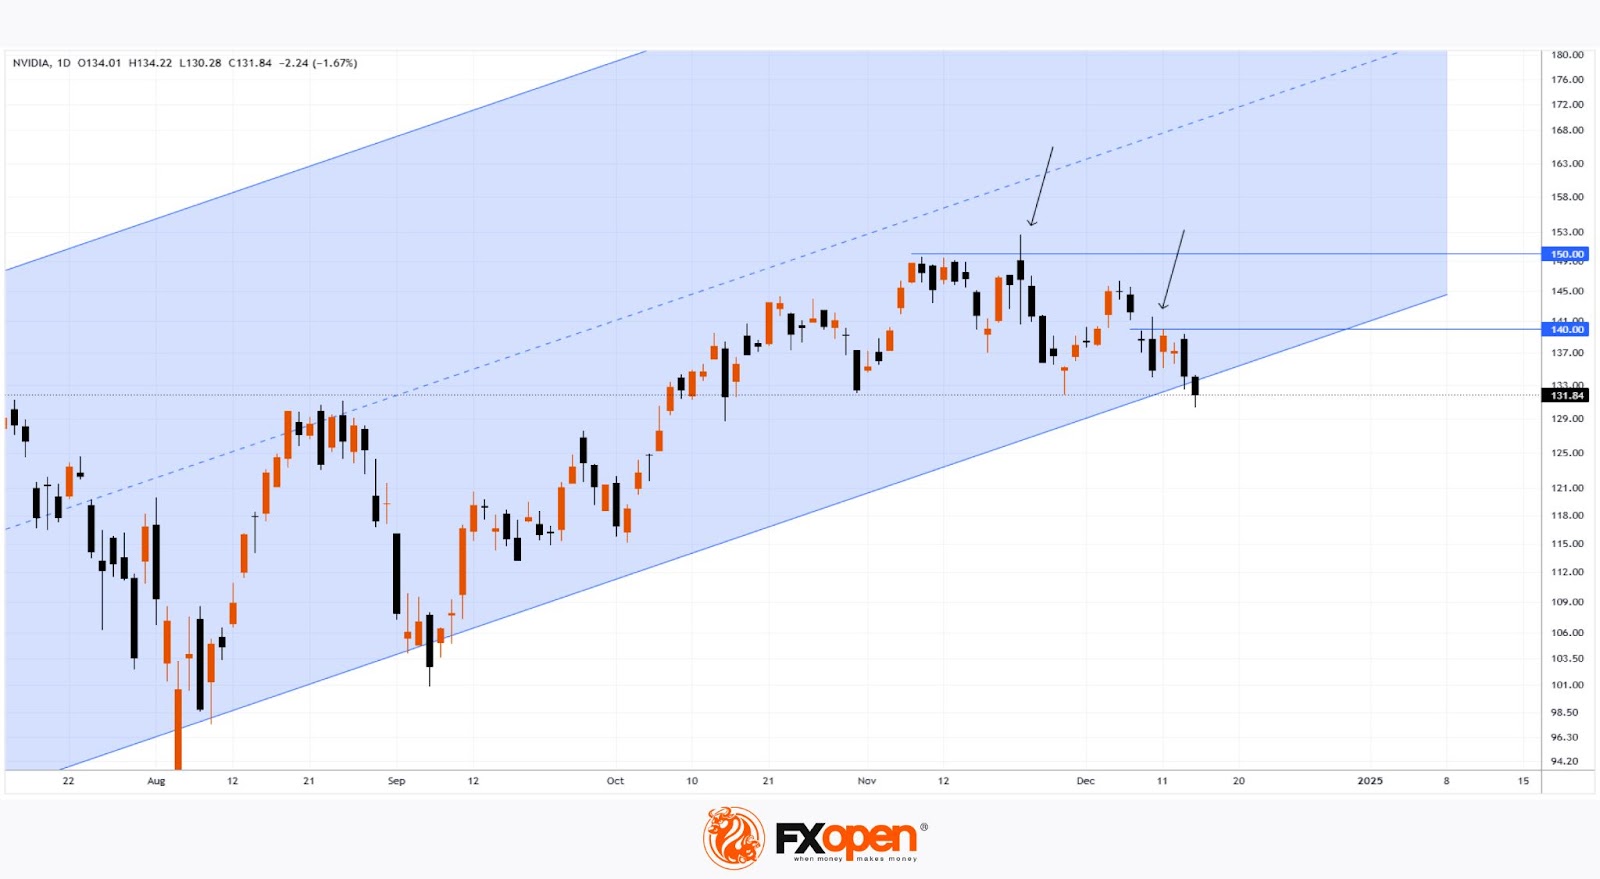
Technical analysis of Nvidia's (NVDA) stock chart reveals a concerning picture — bears may break the lower boundary of the blue channel, which has acted as support throughout 2024. Importantly, bears managed to push the price downwards both from the $150 level and the $140 level (indicated by arrows).
According to the Nasdaq exchange, NVDA's stock price in today's pre-market trading has fallen below $130. If this does not trigger demand for the stock of one of the leading companies in the AI boom, it will be another worrying signal.
According to TipRanks, analysts remain optimistic for now:
→ 37 out of 40 analysts recommend buying NVDA shares.
→ The average price target for NVDA is $177 within 12 months.
Trade global index CFDs with zero commission and tight spreads (additional fees may apply). Open your FXOpen account now or learn more about trading index CFDs with FXOpen.
This article represents the opinion of the Companies operating under the FXOpen brand only. It is not to be construed as an offer, solicitation, or recommendation with respect to products and services provided by the Companies operating under the FXOpen brand, nor is it to be considered financial advice.
Stay ahead of the market!
Subscribe now to our mailing list and receive the latest market news and insights delivered directly to your inbox.


Latest articles

Weekly Market Insights with Gary Thomson: US Inflation, UK GDP, Chair Warsh Testimony, and Earnings
In this video, we’ll explore the key economic events and market trends, shaping the financial landscape. Get ready for insights into financial markets to help you navigate the week ahead. Let’s dive in!
In this episode of Market

GBP/AUD Analysis: The Tug-of-War Begins
Oil is back in the driver's seat, and both the pound and the aussie are feeling its grip. The Bank of England held rates at 3.75% in June, but with UK inflation at 2.8% and crude oil climbing

Australian Dollar Holds Above the Current Market Profile
The minutes from the Reserve Bank of Australia's (RBA) June meeting, released on 30 June, suggested that policymakers are not yet ready to rule out further policy tightening. Board members noted persistent excess demand and broad-based inflationary pressures across the