


FXOpen

On April 4, we wrote that the S&P 500 is showing signs of weakness around the 5,250 level. How is the situation on the stock market developing by today, which is the start of the reporting season for the first quarter?
The S&P 500 fell sharply on Wednesday amid higher-than-expected inflation data.
But the S&P 500 rose yesterday after data showed producer prices rose only slightly in March.
According to Forexfactory:
→ Producer Price Index (PPI) in monthly terms: actual = 0.2%, forecast = 0.3%, a month ago = 0.6%;
→ Core PPI in monthly terms: actual = 0.2%, forecast = 0.2%, a month ago = 0.3%.
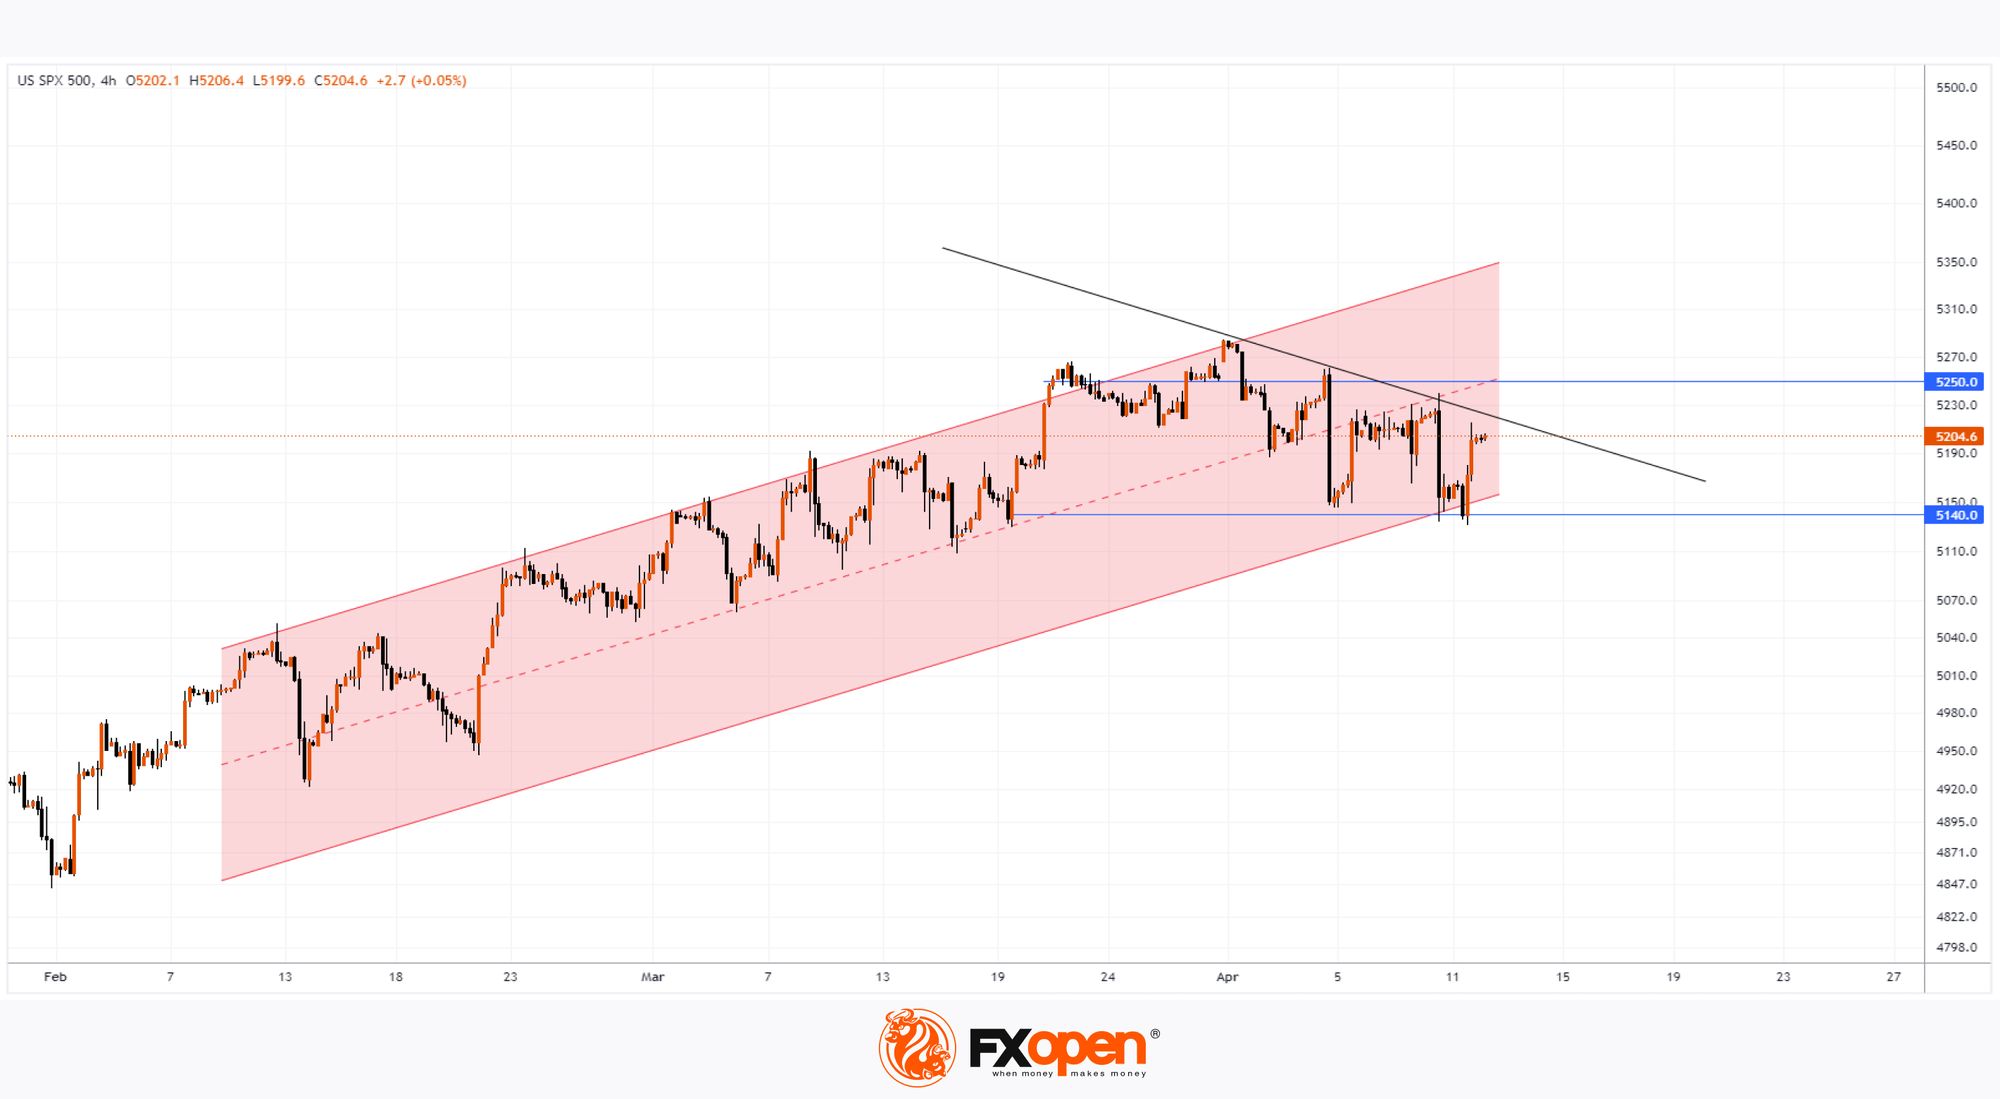
At the same time, a bottom-up reversal has formed on the S&P 500 chart, which:
→ reflects changing moods. Since the publication of the PPI has allayed some concerns about persistently high price pressures in the economy;
→ corrected the location of the lower border of the ascending channel (shown in blue), confirming its action as support.
After news-filled days related to inflation and expectations of a change in Fed monetary policy, investors' focus turns to earnings season. Today after the close of the trading session about JPMorgan Chase & Co
(JPM), Citigroup Inc (C), and Wells Fargo & Co (WFC).
According to technical analysis of the S&P-500 chart:
→ the median line of the ascending channel works as resistance, “not letting” the price into the upper half of the channel. This strengthens the mentioned resistance level of 5250.
→ if the bulls fail to build on Thursday’s momentum, the price may enter consolidation between the levels of 5140 and 5250. The closest test for the sustainability of demand is the trend line (shown in black).
Trade global index CFDs with zero commission and tight spreads (additional fees may apply). Open your FXOpen account now or learn more about trading index CFDs with FXOpen.
This article represents the opinion of the Companies operating under the FXOpen brand only. It is not to be construed as an offer, solicitation, or recommendation with respect to products and services provided by the Companies operating under the FXOpen brand, nor is it to be considered financial advice.
Stay ahead of the market!
Subscribe now to our mailing list and receive the latest market news and insights delivered directly to your inbox.


Latest articles

Consolidation Ahead of NFP: Commodity Currencies Search for Direction
Commodity-linked currencies have entered a consolidation phase following recent directional moves, as market participants adopt a wait-and-see approach ahead of key US labour market data. Current price action reflects a balance between ongoing demand for the US dollar and attempts

The Real Driver Behind the Dollar Rally: Market Insights with Gary Thomson
The US dollar has been firm, but the drivers behind the move may be more complex than they first appear.
While geopolitical tension and shifts in risk sentiment play a role, current price behaviour seems increasingly influenced by inflation expectations

EUR/USD and USD/CHF Pull Back: Market Reacts to Fundamentals
European currencies have shown a recovery in recent trading sessions after their recent decline, displaying early signs of a reversal. The US dollar is weakening amid expectations surrounding upcoming US macroeconomic data, while market participants are reassessing their short-term positions