


S&P 500 Price Consolidates ahead of Earnings Season
FXOpen

On April 4, we wrote that the S&P 500 is showing signs of weakness around the 5,250 level. How is the situation on the stock market developing by today, which is the start of the reporting season for the first quarter?
The S&P 500 fell sharply on Wednesday amid higher-than-expected inflation data.
But the S&P 500 rose yesterday after data showed producer prices rose only slightly in March.
According to Forexfactory:
→ Producer Price Index (PPI) in monthly terms: actual = 0.2%, forecast = 0.3%, a month ago = 0.6%;
→ Core PPI in monthly terms: actual = 0.2%, forecast = 0.2%, a month ago = 0.3%.
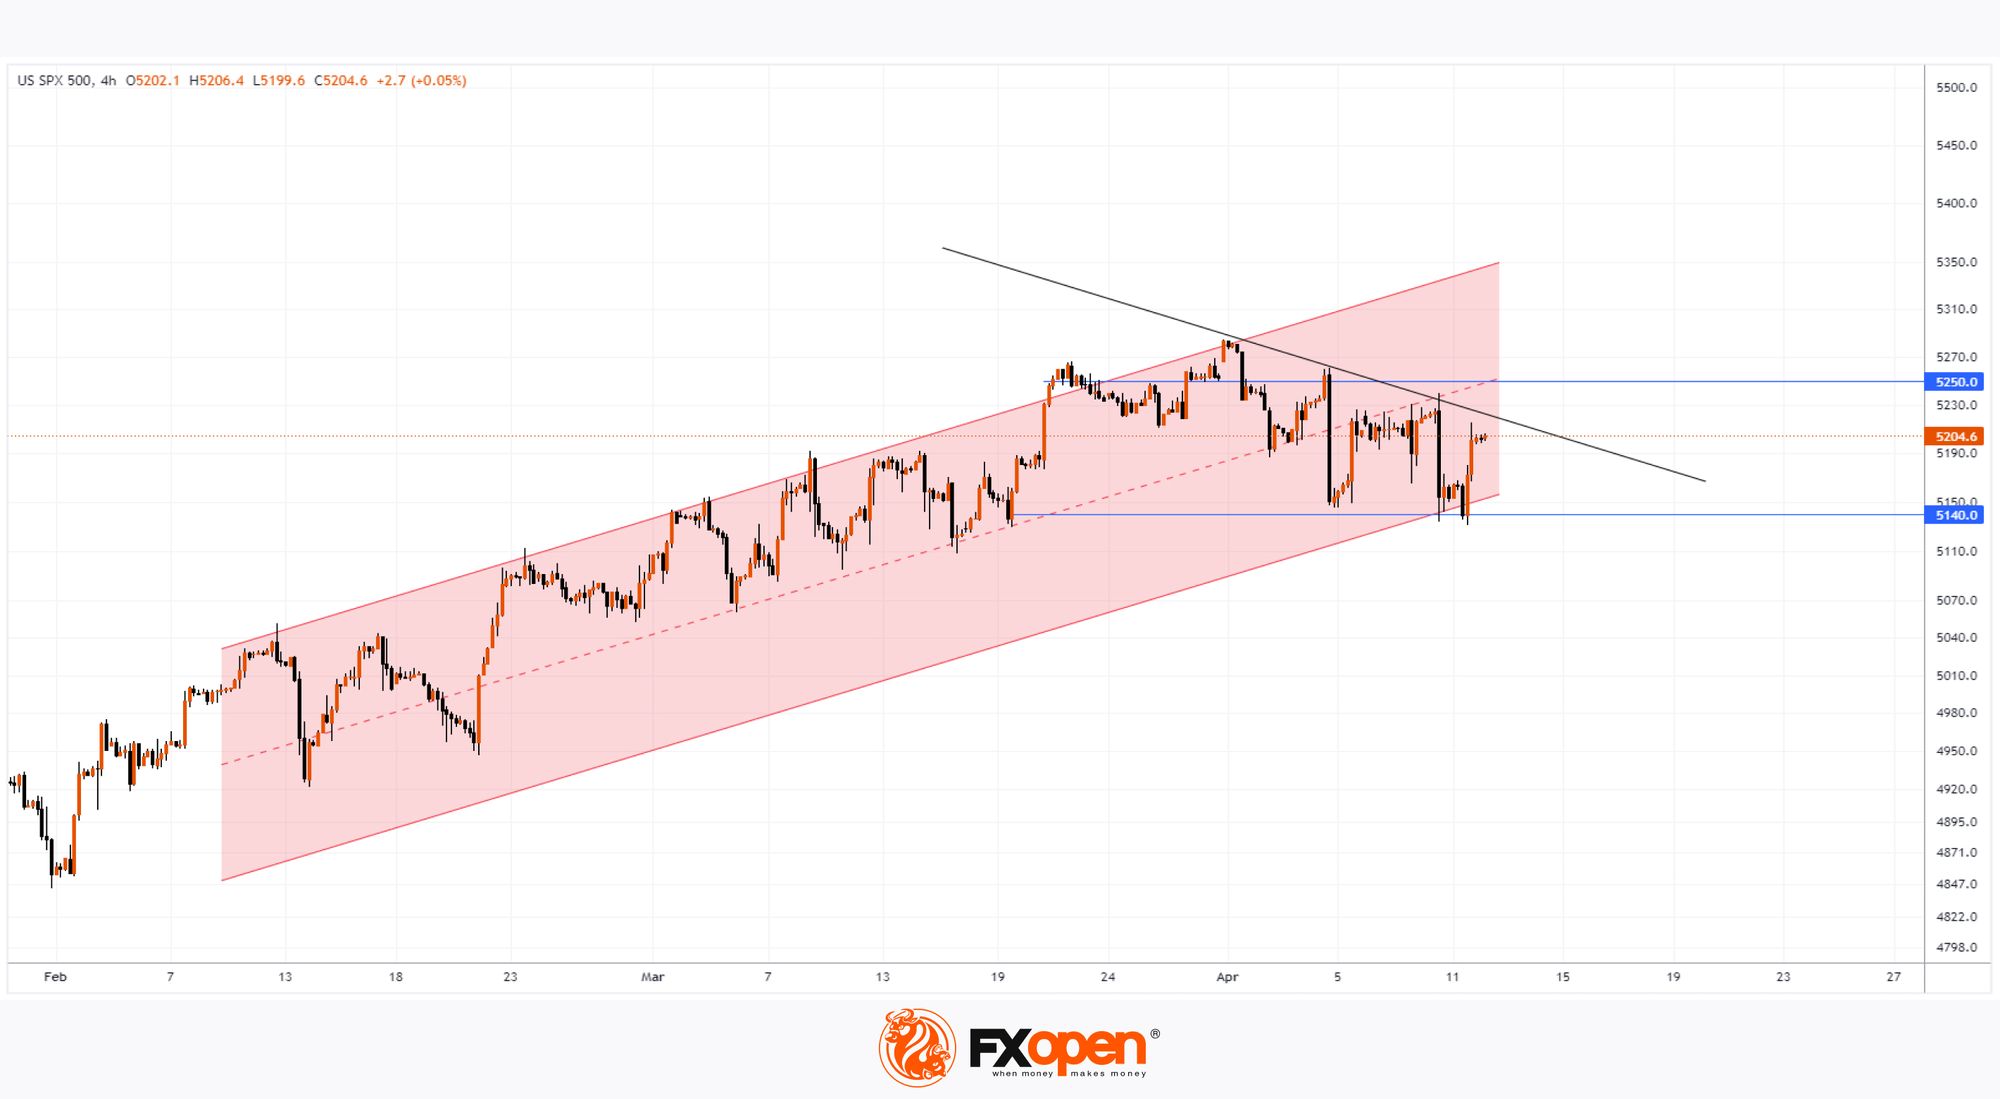
At the same time, a bottom-up reversal has formed on the S&P 500 chart, which:
→ reflects changing moods. Since the publication of the PPI has allayed some concerns about persistently high price pressures in the economy;
→ corrected the location of the lower border of the ascending channel (shown in blue), confirming its action as support.
After news-filled days related to inflation and expectations of a change in Fed monetary policy, investors' focus turns to earnings season. Today after the close of the trading session about JPMorgan Chase & Co
(JPM), Citigroup Inc (C), and Wells Fargo & Co (WFC).
According to technical analysis of the S&P-500 chart:
→ the median line of the ascending channel works as resistance, “not letting” the price into the upper half of the channel. This strengthens the mentioned resistance level of 5250.
→ if the bulls fail to build on Thursday’s momentum, the price may enter consolidation between the levels of 5140 and 5250. The closest test for the sustainability of demand is the trend line (shown in black).
Trade global index CFDs with zero commission and tight spreads (additional fees may apply). Open your FXOpen account now or learn more about trading index CFDs with FXOpen.
This article represents the opinion of the Companies operating under the FXOpen brand only. It is not to be construed as an offer, solicitation, or recommendation with respect to products and services provided by the Companies operating under the FXOpen brand, nor is it to be considered financial advice.
Stay ahead of the market!
Subscribe now to our mailing list and receive the latest market news and insights delivered directly to your inbox.


Latest articles

AI Valuations Are Back in the Spotlight
Artificial intelligence remains the dominant investment theme of 2026, but investors are increasingly questioning whether AI stock valuations are keeping pace with reality.
💰 Big Tech continues to invest at an unprecedented scale, with hyperscaler AI spending projected to exceed $800

AUD/CAD: Months of Indecision — Is a Breakout Finally Coming?
The Australian dollar has clawed back most of its end-of-June losses, when it touched three-month lows against the greenback amid escalating Middle East tensions. Since then, sentiment has improved: the RBA's Assistant Governor Sarah Hunter signalled the board stands ready

USD/JPY: Battling at the Top of the Triangle
On 3 July, Japan's Finance Minister, Satsuki Katayama, stated that the Ministry of Finance remains in close contact with US authorities regarding developments in USD/JPY as the yen traded near its weakest level in almost 40 years. Similar verbal