


FXOpen

As seen on the XAG/USD chart, silver has today breached the upper boundary of the descending channel formed by February’s lower highs and lows.
Bullish sentiment is supported by heightened geopolitical tensions and rising demand for safe-haven assets. According to media reports:
→ On Thursday, US President Donald Trump warned Iran that it must reach an agreement on its nuclear programme, or “really bad things” would happen, setting a 10–15 day deadline.
→ In response, Tehran threatened retaliatory strikes on US bases in the region if attacked.
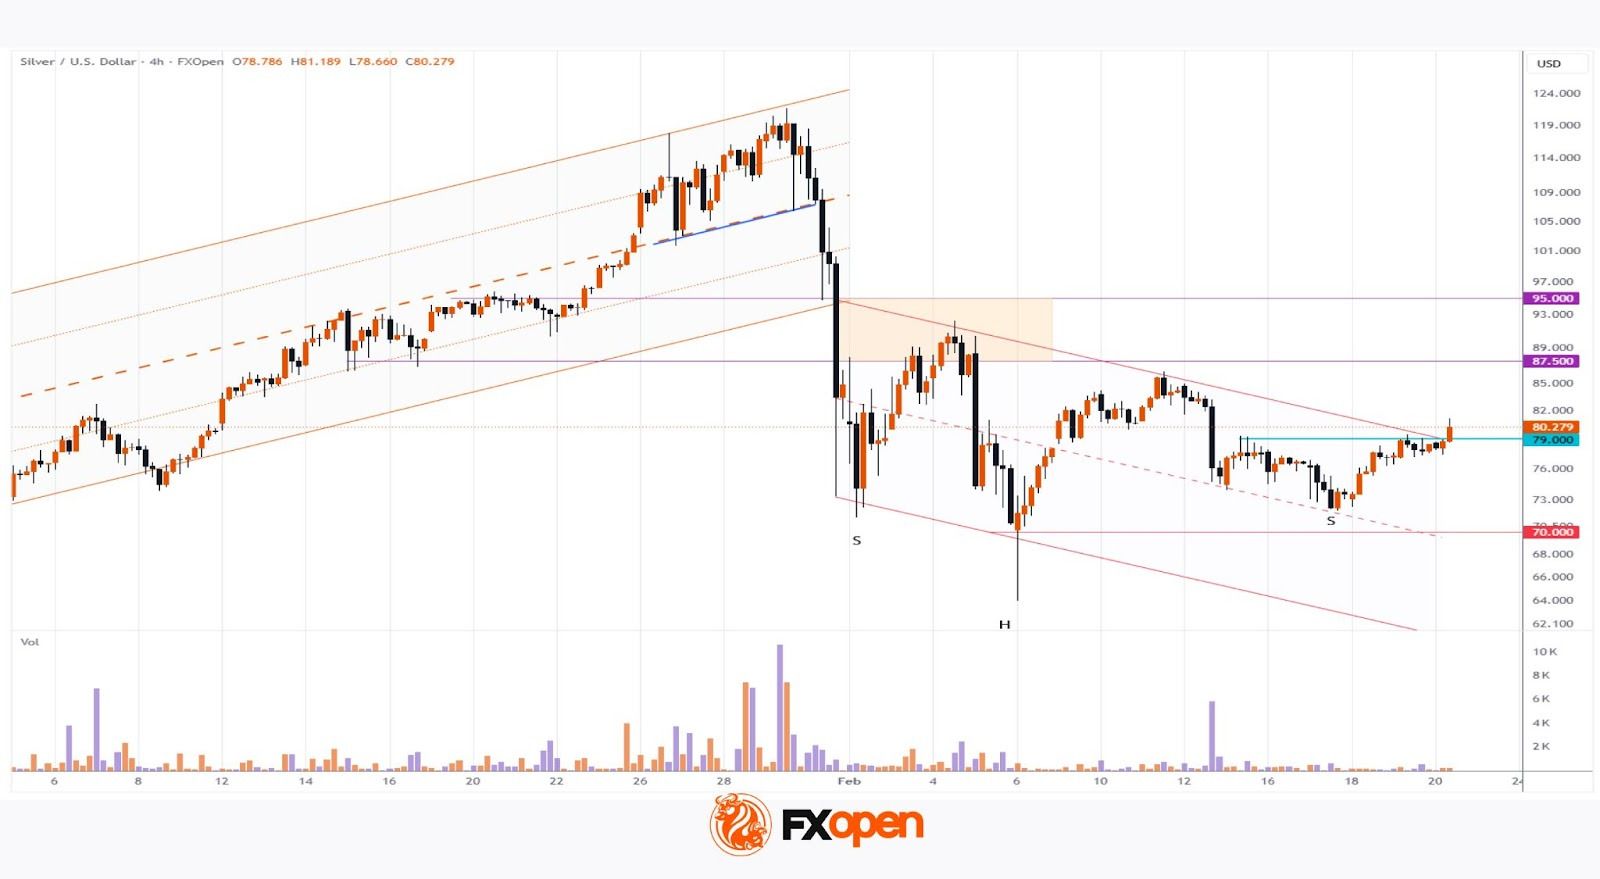
On 11 February, analysing the XAG/USD chart, we noted that silver was consolidating between two key levels:
→ resistance around $87.5–95
→ support near $70
Today’s bullish breakout of the channel’s upper boundary – which acted as resistance in February – can be interpreted as a move towards the $87.5–95 zone.
Confidence for bulls is further reinforced by an inverted head and shoulders (SHS) pattern. If buyers are determined, this should be confirmed by XAG/USD holding above:
→ the channel breakout level near $79
→ the psychological $80 mark.
Start trading commodity CFDs with tight spreads (additional fees may apply). Open your trading account now or learn more about trading commodity CFDs with FXOpen.
This article represents the opinion of the Companies operating under the FXOpen brand only. It is not to be construed as an offer, solicitation, or recommendation with respect to products and services provided by the Companies operating under the FXOpen brand, nor is it to be considered financial advice.
Stay ahead of the market!
Subscribe now to our mailing list and receive the latest market news and insights delivered directly to your inbox.


Latest articles

Consolidation Ahead of NFP: Commodity Currencies Search for Direction
Commodity-linked currencies have entered a consolidation phase following recent directional moves, as market participants adopt a wait-and-see approach ahead of key US labour market data. Current price action reflects a balance between ongoing demand for the US dollar and attempts

The Real Driver Behind the Dollar Rally: Market Insights with Gary Thomson
The US dollar has been firm, but the drivers behind the move may be more complex than they first appear.
While geopolitical tension and shifts in risk sentiment play a role, current price behaviour seems increasingly influenced by inflation expectations

EUR/USD and USD/CHF Pull Back: Market Reacts to Fundamentals
European currencies have shown a recovery in recent trading sessions after their recent decline, displaying early signs of a reversal. The US dollar is weakening amid expectations surrounding upcoming US macroeconomic data, while market participants are reassessing their short-term positions