


FXOpen

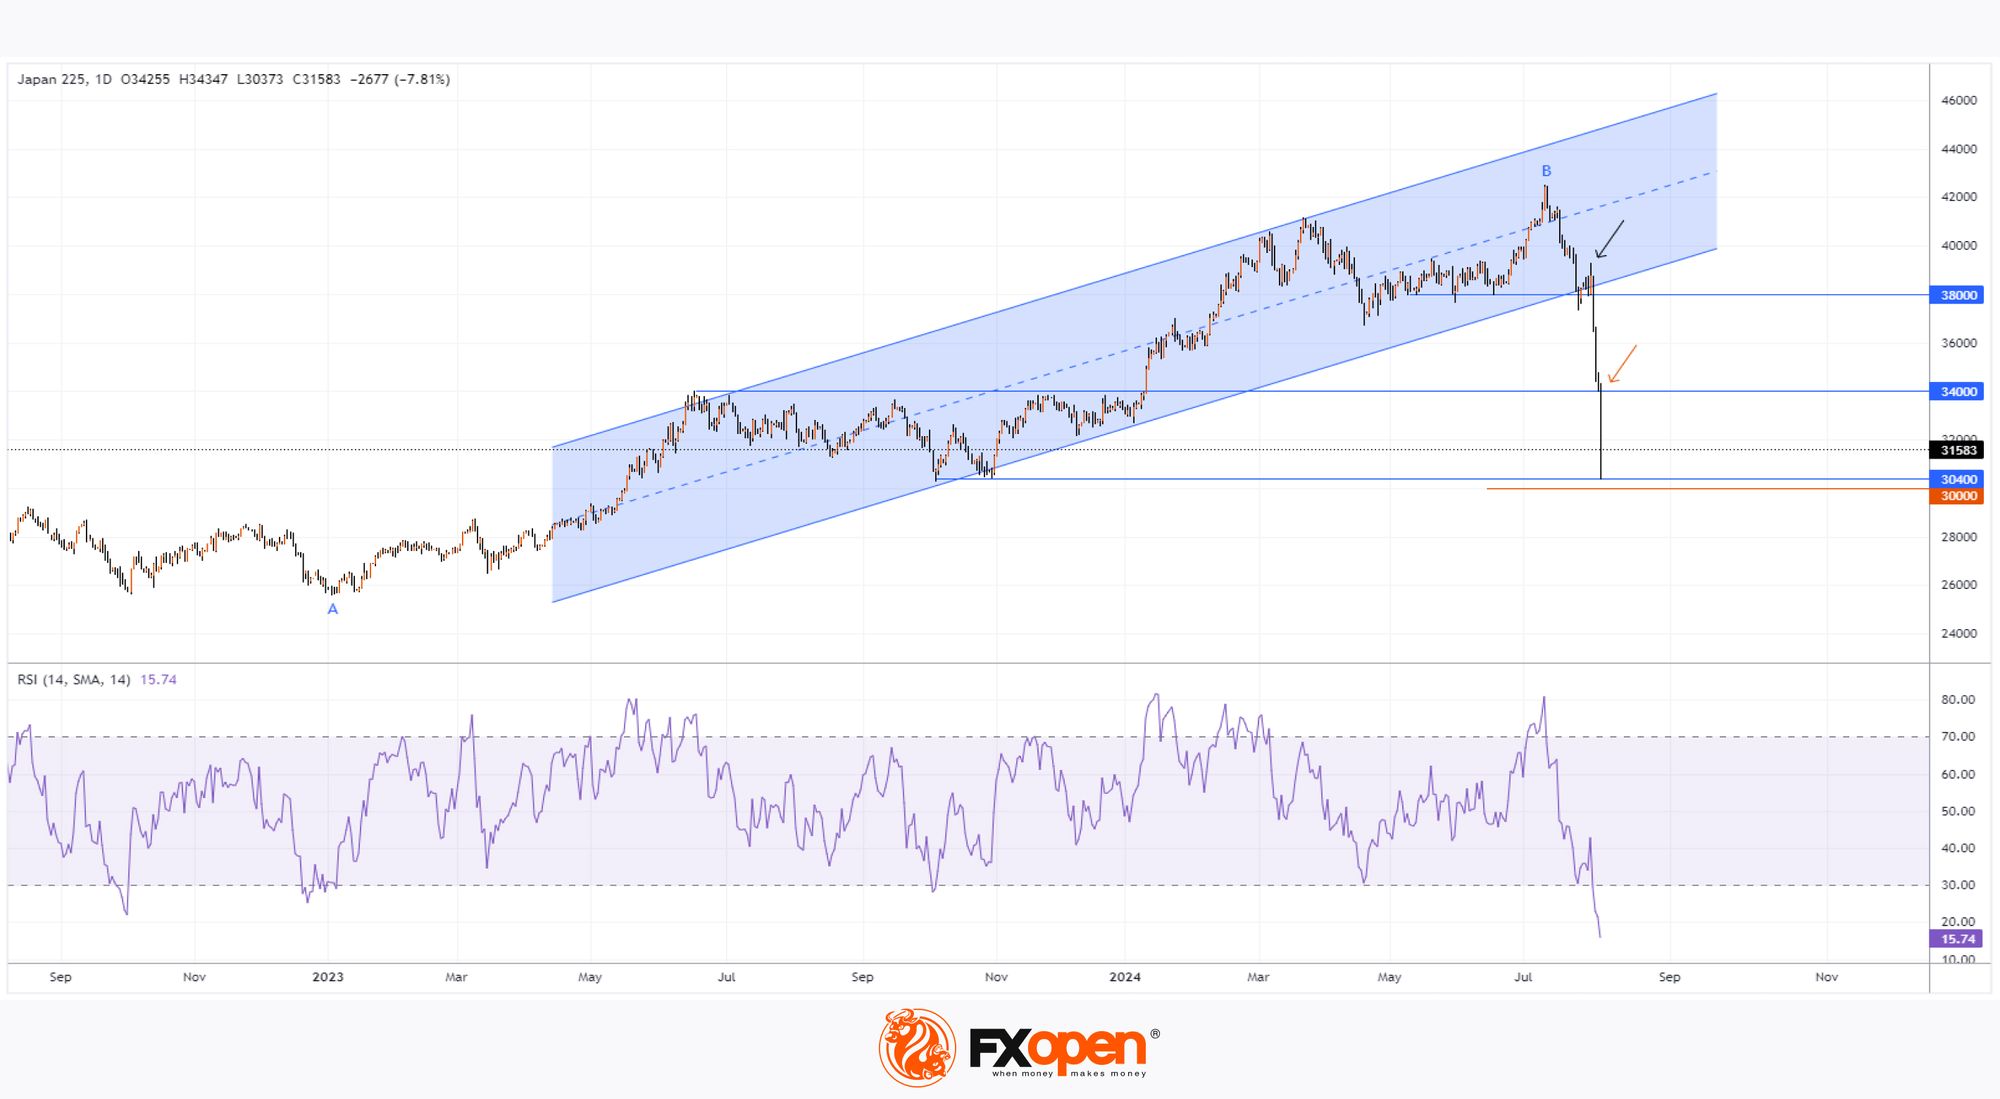
As shown by the Nikkei 225 (Japan 225 on FXOpen) chart:
→ In less than a month, the index price has dropped by more than 25%, providing grounds to suggest the start of a bear market;
→ The price has approached the psychological level of 30,000 points – the last time the price was this low was in autumn 2023.
Bearish sentiment is being driven by a combination of the following factors:
→ Negative news from the US labour market, published on Friday – this has significantly increased discussions about the likelihood of a recession;
→ The Bank of Japan’s interest rate hike last Wednesday to support the excessively weak yen.
As we wrote on 15 July, while analysing the Nikkei 225 index (Japan 225 on FXOpen):
→ Signs of bearish activity were observed around the 41,330 level;
→ The upward channel may break in the second half of the year.
It turned out that the bullish channel was broken much earlier and in an extremely aggressive manner – the bulls attempted to resume the trend from its lower boundary (shown by the black arrow), taking advantage of the 38,000 support, but were defeated.
What could happen next?
Technical analysis of the Nikkei 225 (Japan 225 on FXOpen) chart shows:
→ The price broke through (shown by the orange arrow) the previous resistance at 34,000, which is around 50% of the upward move from A to B;
→ The RSI index has moved into deep oversold territory;
→ The price has fallen into the region of the block formed by the 30,400 support and the psychological level of 30,000 – note the strong rebound from it, indicating the activation of demand (these are signs of an emotional selling climax in Wyckoff method terminology).
Given the abnormal surge in volatility, it is reasonable to assume that the market may enter a consolidation phase to establish a new balance of supply and demand, taking into account the latest news releases. It is possible that the mentioned support block will hold, and the 34,000 level will influence the Nikkei 225 (Japan 225 on FXOpen) price in forming the upper boundary of the anticipated consolidation range.
Trade global index CFDs with zero commission and tight spreads (additional fees may apply). Open your FXOpen account now or learn more about trading index CFDs with FXOpen.
This article represents the opinion of the Companies operating under the FXOpen brand only. It is not to be construed as an offer, solicitation, or recommendation with respect to products and services provided by the Companies operating under the FXOpen brand, nor is it to be considered financial advice.
Stay ahead of the market!
Subscribe now to our mailing list and receive the latest market news and insights delivered directly to your inbox.


Latest articles

Market Analysis: GBP/USD Dips Further As EUR/GBP Regains Traction
GBP/USD failed to climb above 1.3500 and corrected some gains. EUR/GBP started a decent increase and might aim for more gains above 0.8700.
Important Takeaways for GBP/USD and EUR/GBP Analysis Today
· The British Pound


Market Insights with Gary Thomson: Oil, US Retail Sales & NFP in Focus
In this video, we’ll explore the key economic events and market trends, shaping the financial landscape. Get ready for insights into financial markets to help you navigate the week ahead. Let’s dive in!
In this episode of Market